This article was originally written by Nicholas Thomson and Kassen Qian of Datadog and published on the Datadog blog.
As the complexity of modern software development lifecycles increases, it’s important to have a comprehensive monitoring solution for your continuous integration (CI) pipelines so that you can quickly pinpoint and triage issues, especially when you have a large number of pipelines running.
Datadog now offers deep, end-to-end visibility into your TeamCity builds with the new TeamCity integration for CI Pipeline Visibility, helping you identify bottlenecks in your CI system, track and address performance regressions, and proactively improve the efficiency of your CI system.
Making data-driven decisions to increase the performance and reliability of your pipelines will help you improve end-user experience by allowing your team to push code releases faster and with fewer errors.
In this post, we’ll show you how to:
Integrate TeamCity with CI Visibility
Investigate pipeline failures to fix erroneous builds
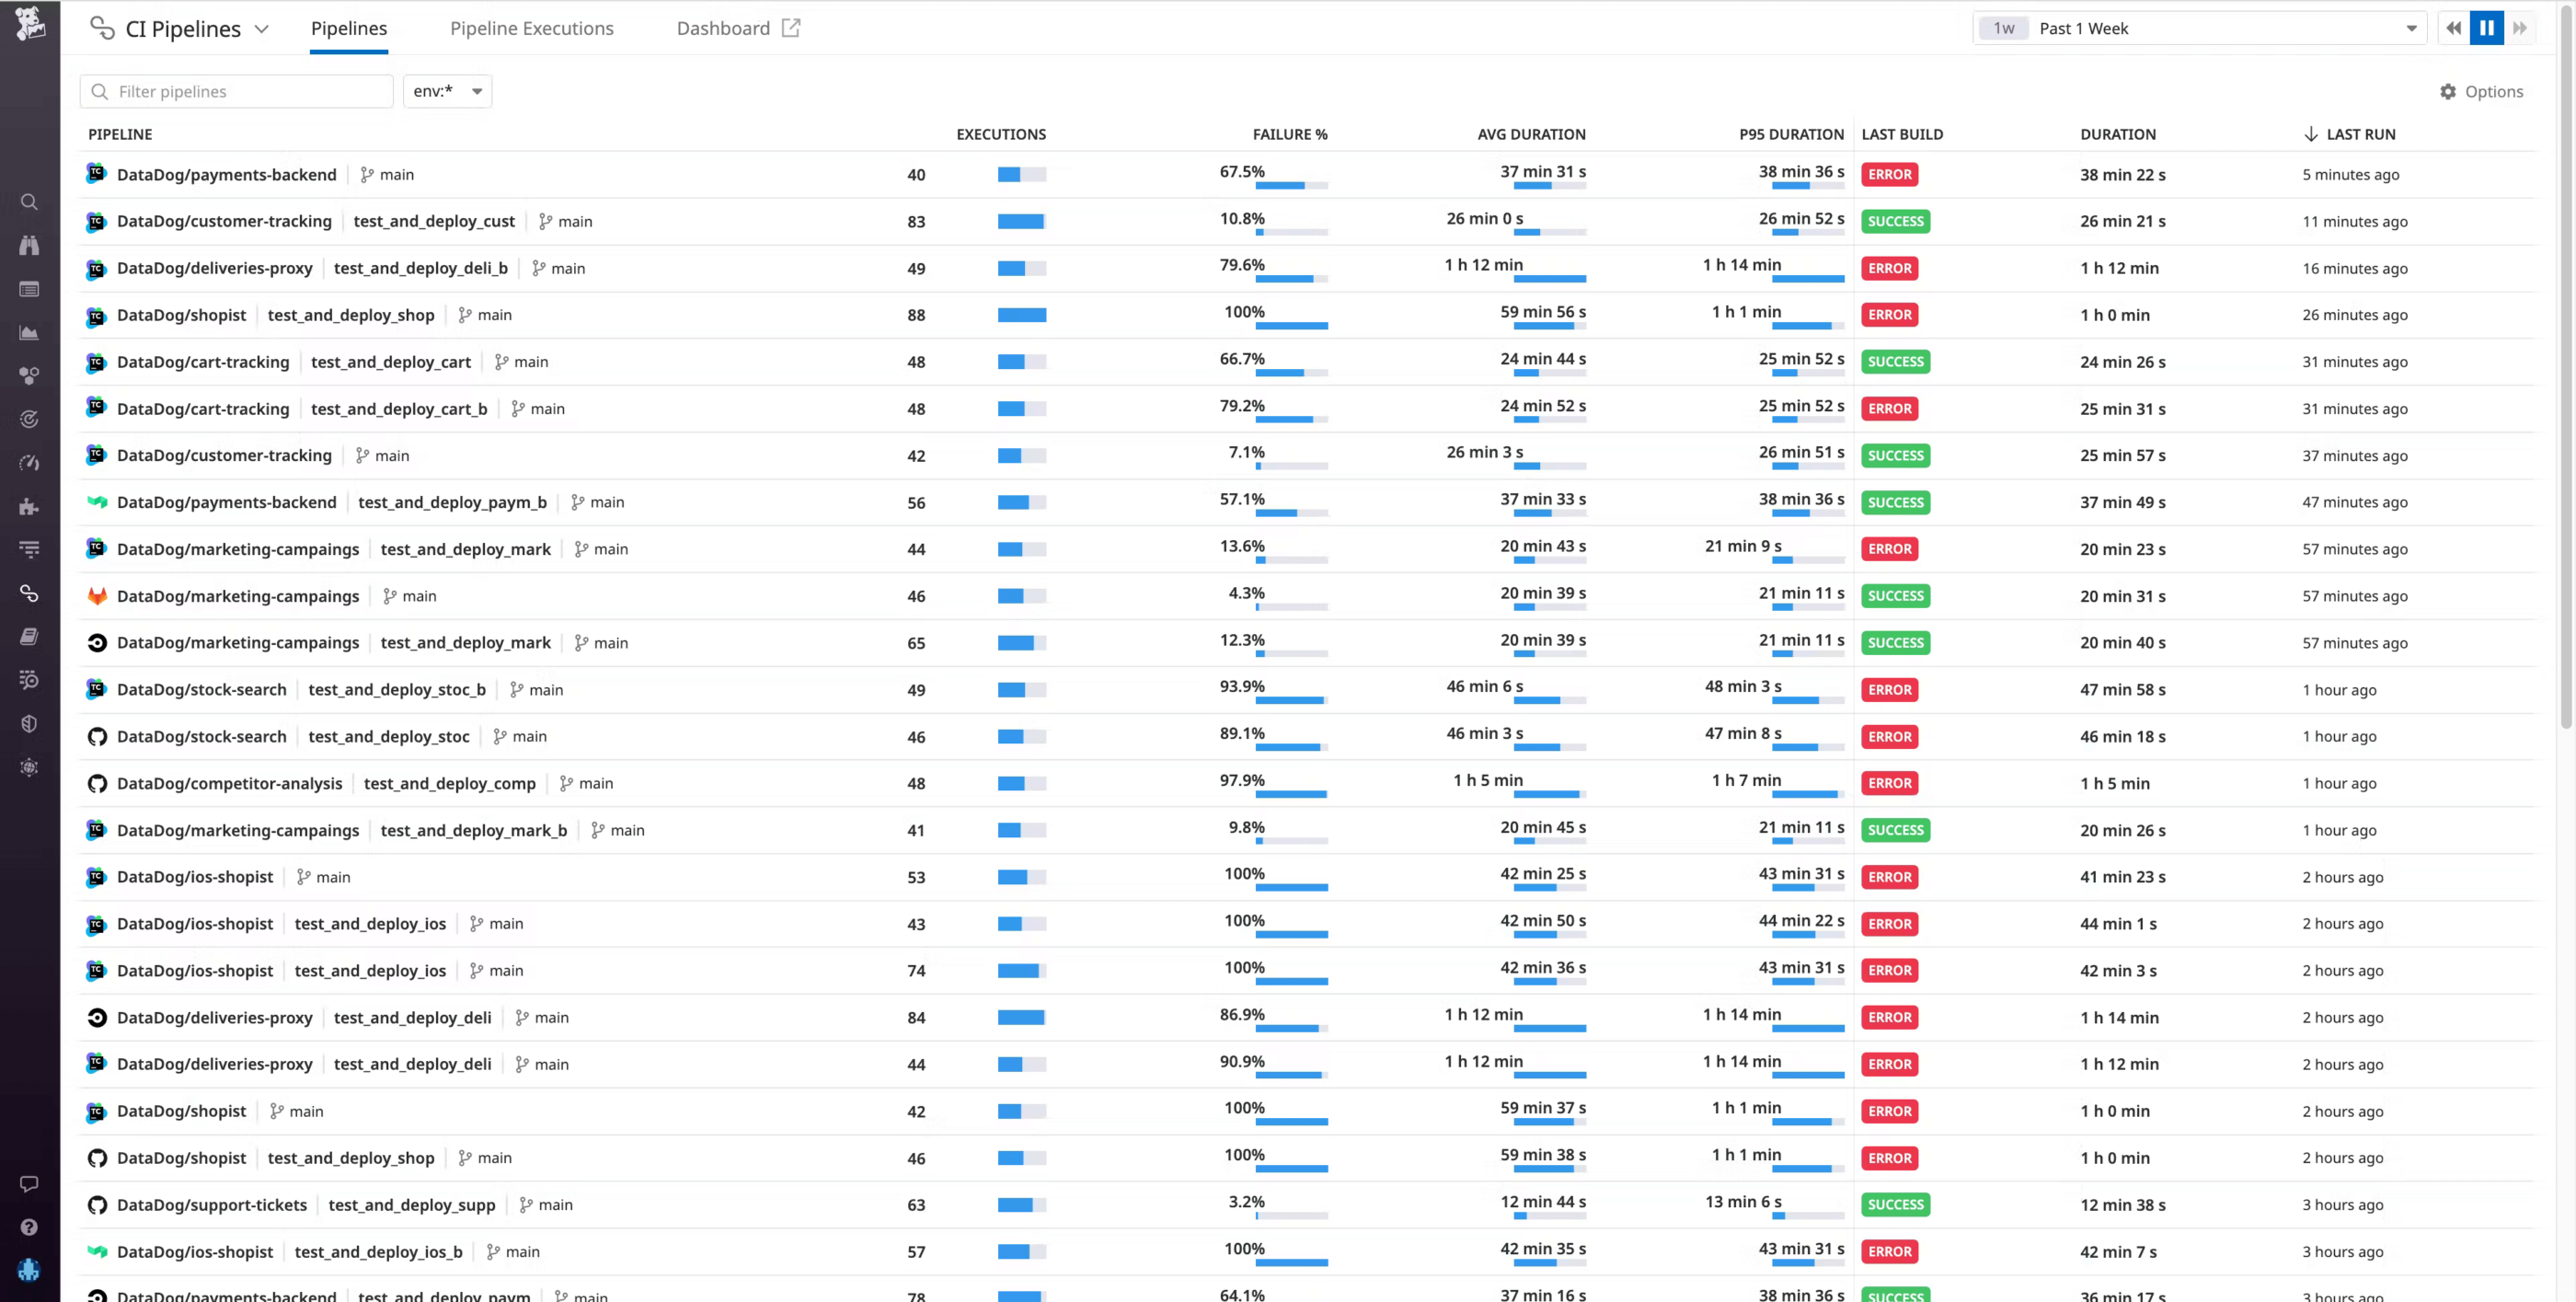
Once you’ve enabled the integration, data from your TeamCity pipelines will automatically flow into Datadog. If you navigate to the Pipelines page, you can see TeamCity pipelines alongside any other providers you may have instrumented with CI Visibility.
Investigate pipeline failures to fix erroneous builds
After you enable the TeamCity integration in CI Visibility, you can use the Pipeline overview page to get a high-level view of the health and performance of your TeamCity build chains, with key metrics such as executions, failure rate, build duration, and more.
Say you’re an engineer at an e-commerce company where one of the checkout services for your primary application is undergoing a major revamp under a tight deadline. After pushing new code, you notice that your builds are extremely slow—much slower than normal. You can go to the Pipelines page in CI Visibility to confirm if your particular pipeline is experiencing high build durations. Then, you can click on the build chain from the Pipeline overview page to investigate the pipeline in more detail.
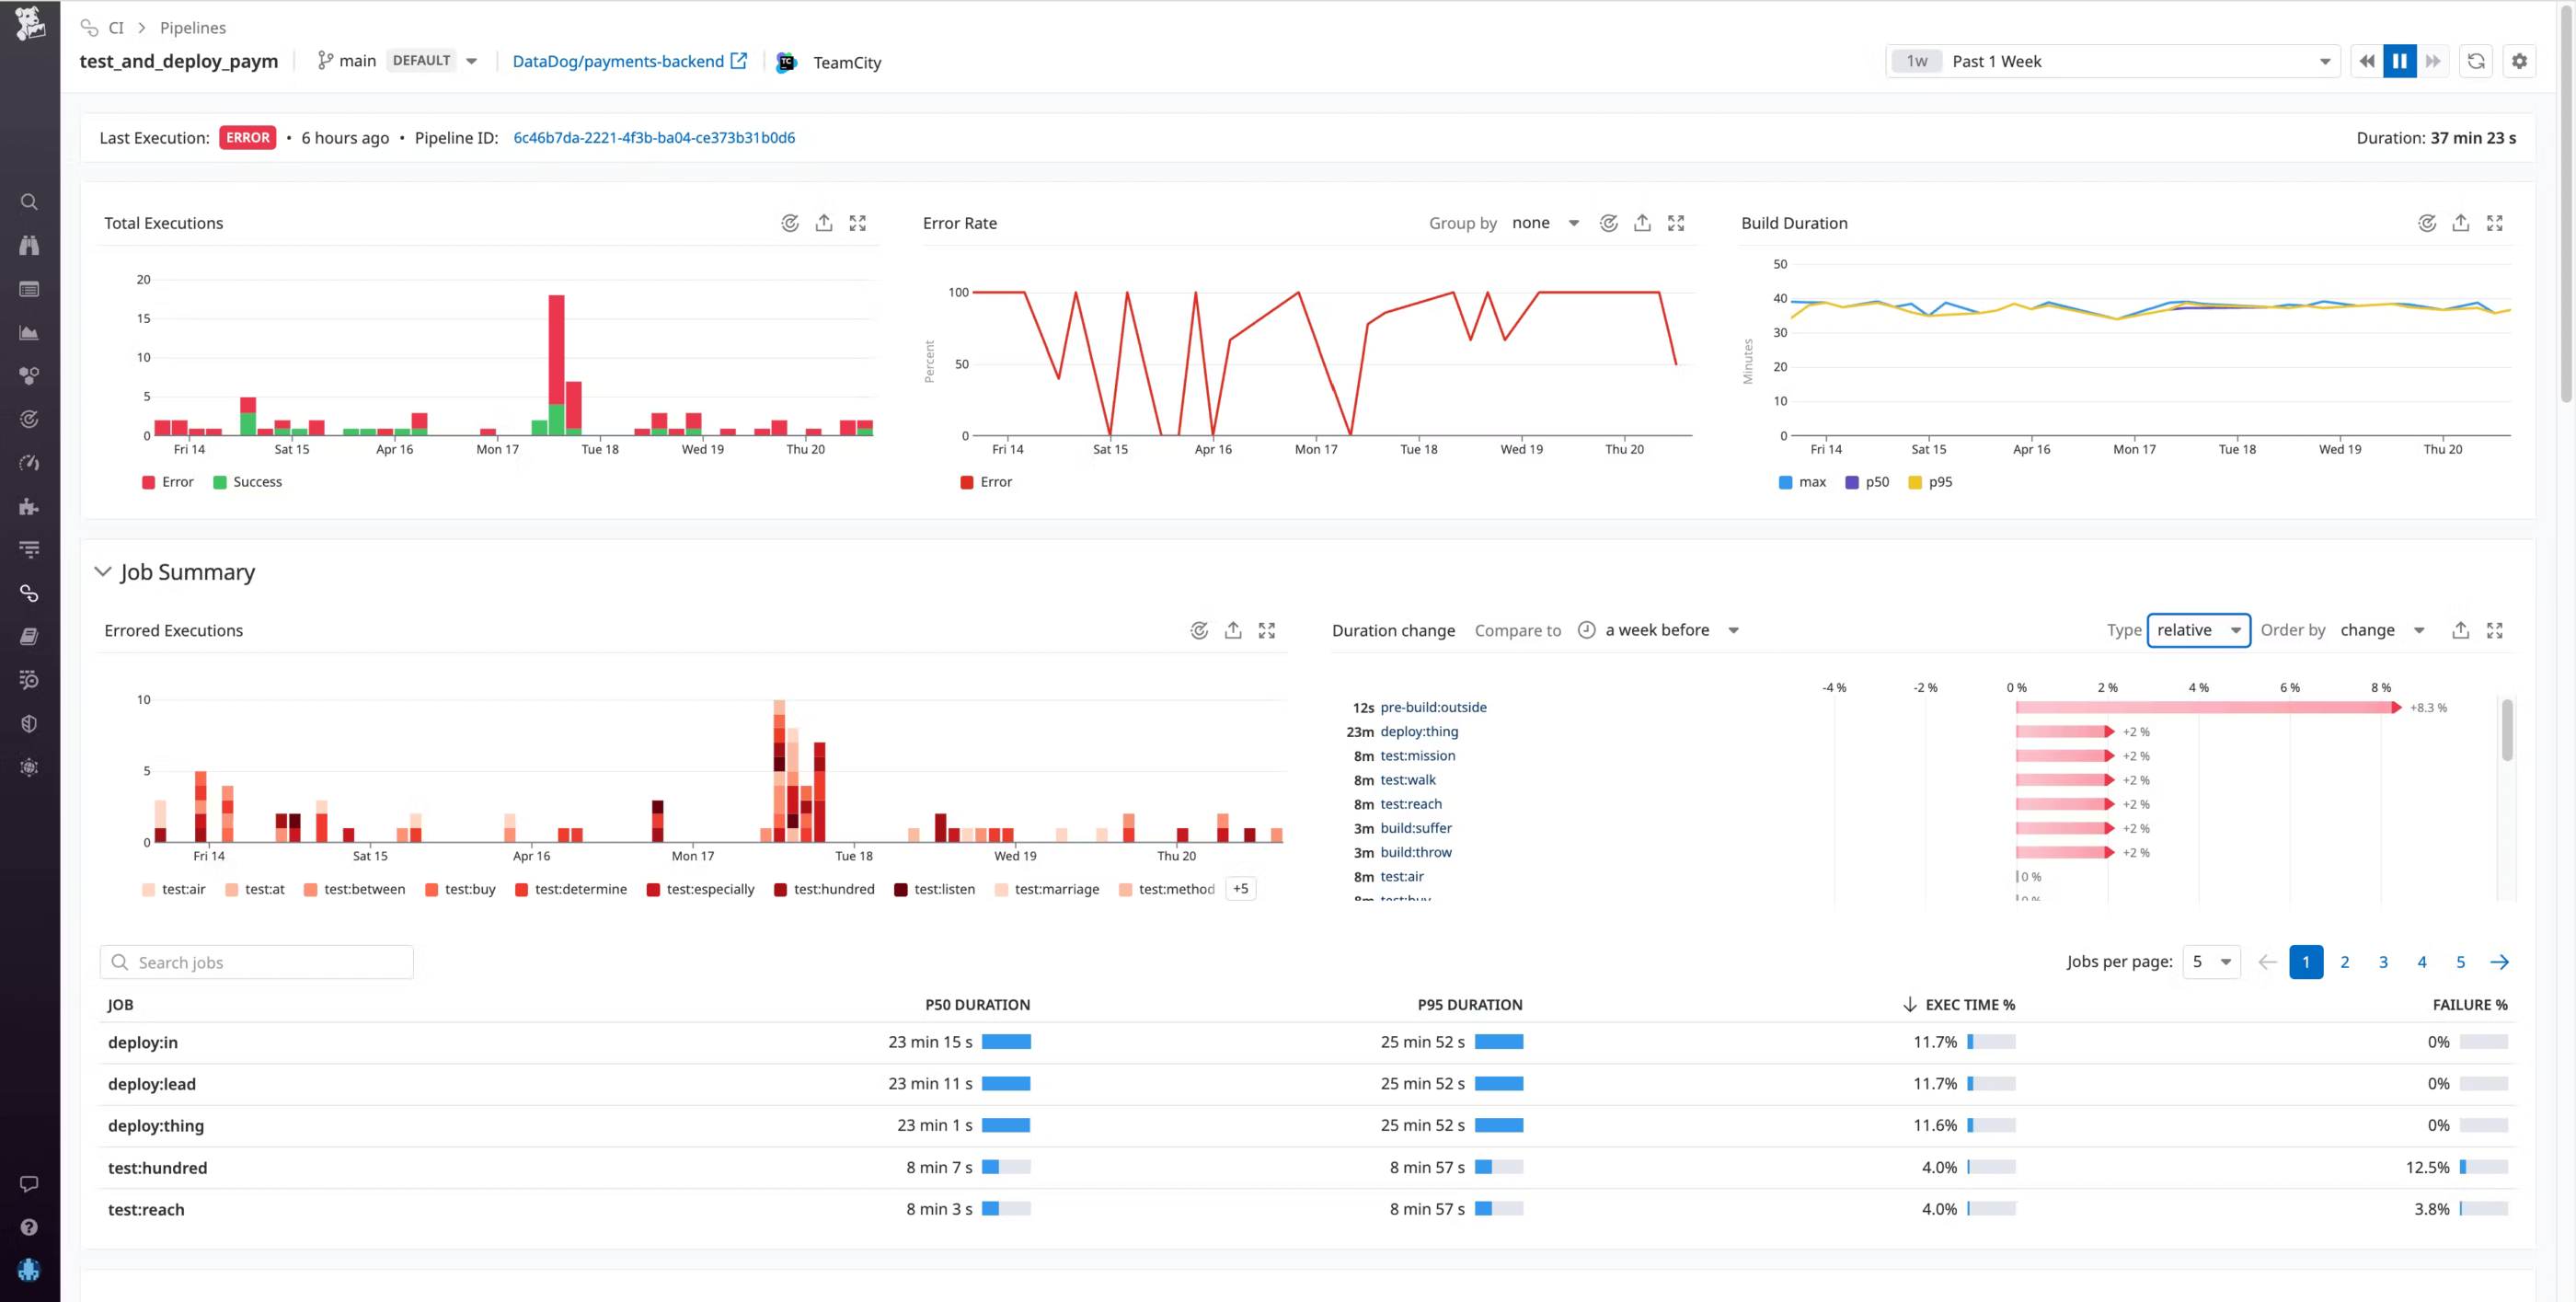
At the top of this Pipeline Detail view, you can see the status of the last build, with a link to the build chain in TeamCity. Below that are timeseries widgets illustrating the total number of builds, the error rate, build duration, and other key metrics that can help you determine when the build chain began to experience errors. In this case, you see the error rate spiking repeatedly over the past several days.
The Job Summary gives you more granular information about your build chain, such as which specific jobs in this pipeline failed the most, which ones took the longest, and which jobs have experienced performance regressions compared to the previous week. Information like this can help you identify the areas in your CI system where optimization will result in the greatest performance gains.
To investigate further, you can scroll down to see the individual builds for this pipeline. If you click on an execution, you can see a flame graph view that visually breaks down the pipeline execution into the individual jobs that ran sequentially and in parallel.
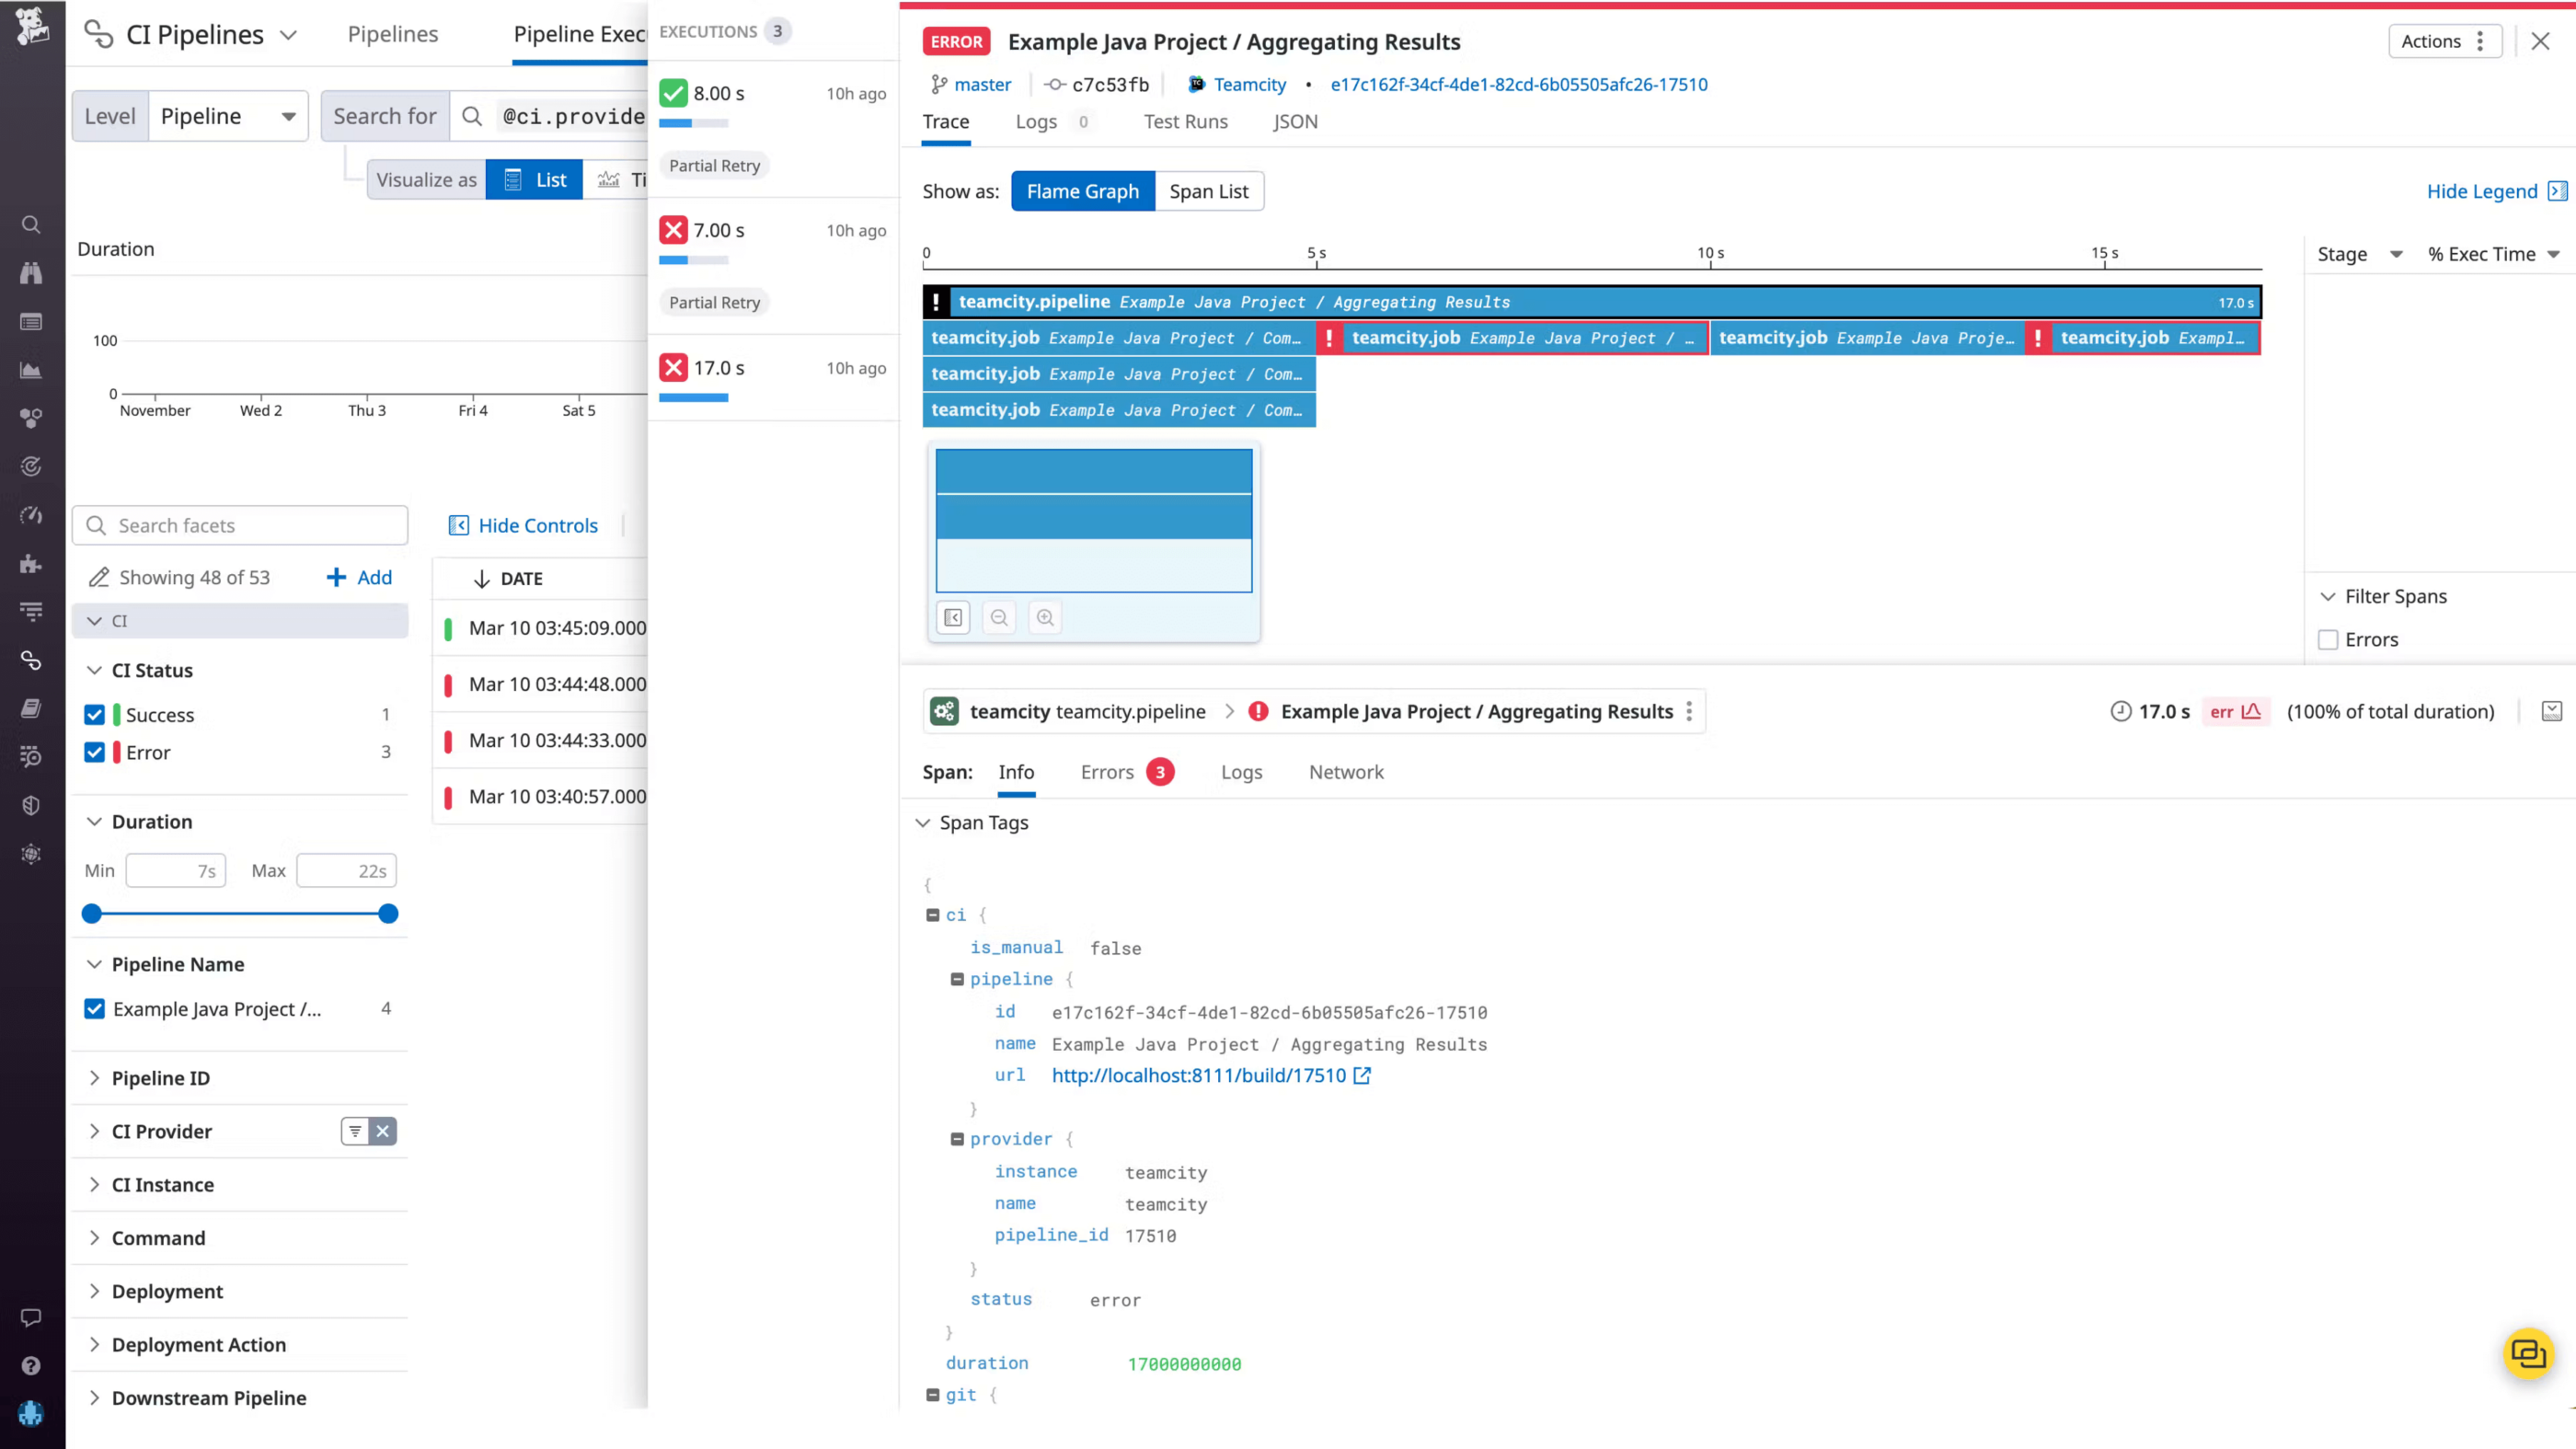
The flame graph shows you each build’s respective duration broken down by job and, if the build was erroneous, the exact parts of the build that failed. This can help you pinpoint problematic jobs that may be at the root of a failed build.
The Info tab shows you repository and commit information along with other git metadata, so you can easily see the source of each build. To investigate further, you reach out to the team member who pushed the commit for this build and discover that the issue is caused by a typo. (We strongly recommend that customers use a TeamCity username style that contains author email, so that Datadog can automatically detect git author email addresses and correlate commit information to pipeline data.)
Once resolved, the build chain functions without error so you can build and test successfully, and release your updated checkout service to customers on time.
Understand and optimize TeamCity build chain performance
CI Visibility support for TeamCity is now generally available, giving you deep visibility into your build chains so you can troubleshoot failed builds, identify performance regressions faster, and increase your release velocity.
To help you take advantage of the Kotlin DSL’s capabilities and simplify the build configuration process, we’ve created extensive Kotlin DSL documentation. It comes with examples that you can simply copy-paste directly into your code base.
How the Kotlin DSL documentation works
Every TeamCity server has its own Kotlin DSL documentation, which is automatically curated to match the TeamCity version and any plugins installed on the server. If you install a new plugin, the documentation compiles again, providing you with relevant examples. You can also refer to the general Kotlin DSL documentation, which is available in the TeamCity docs.
Accessing the Kotlin DSL documentation from IntelliJ IDEA
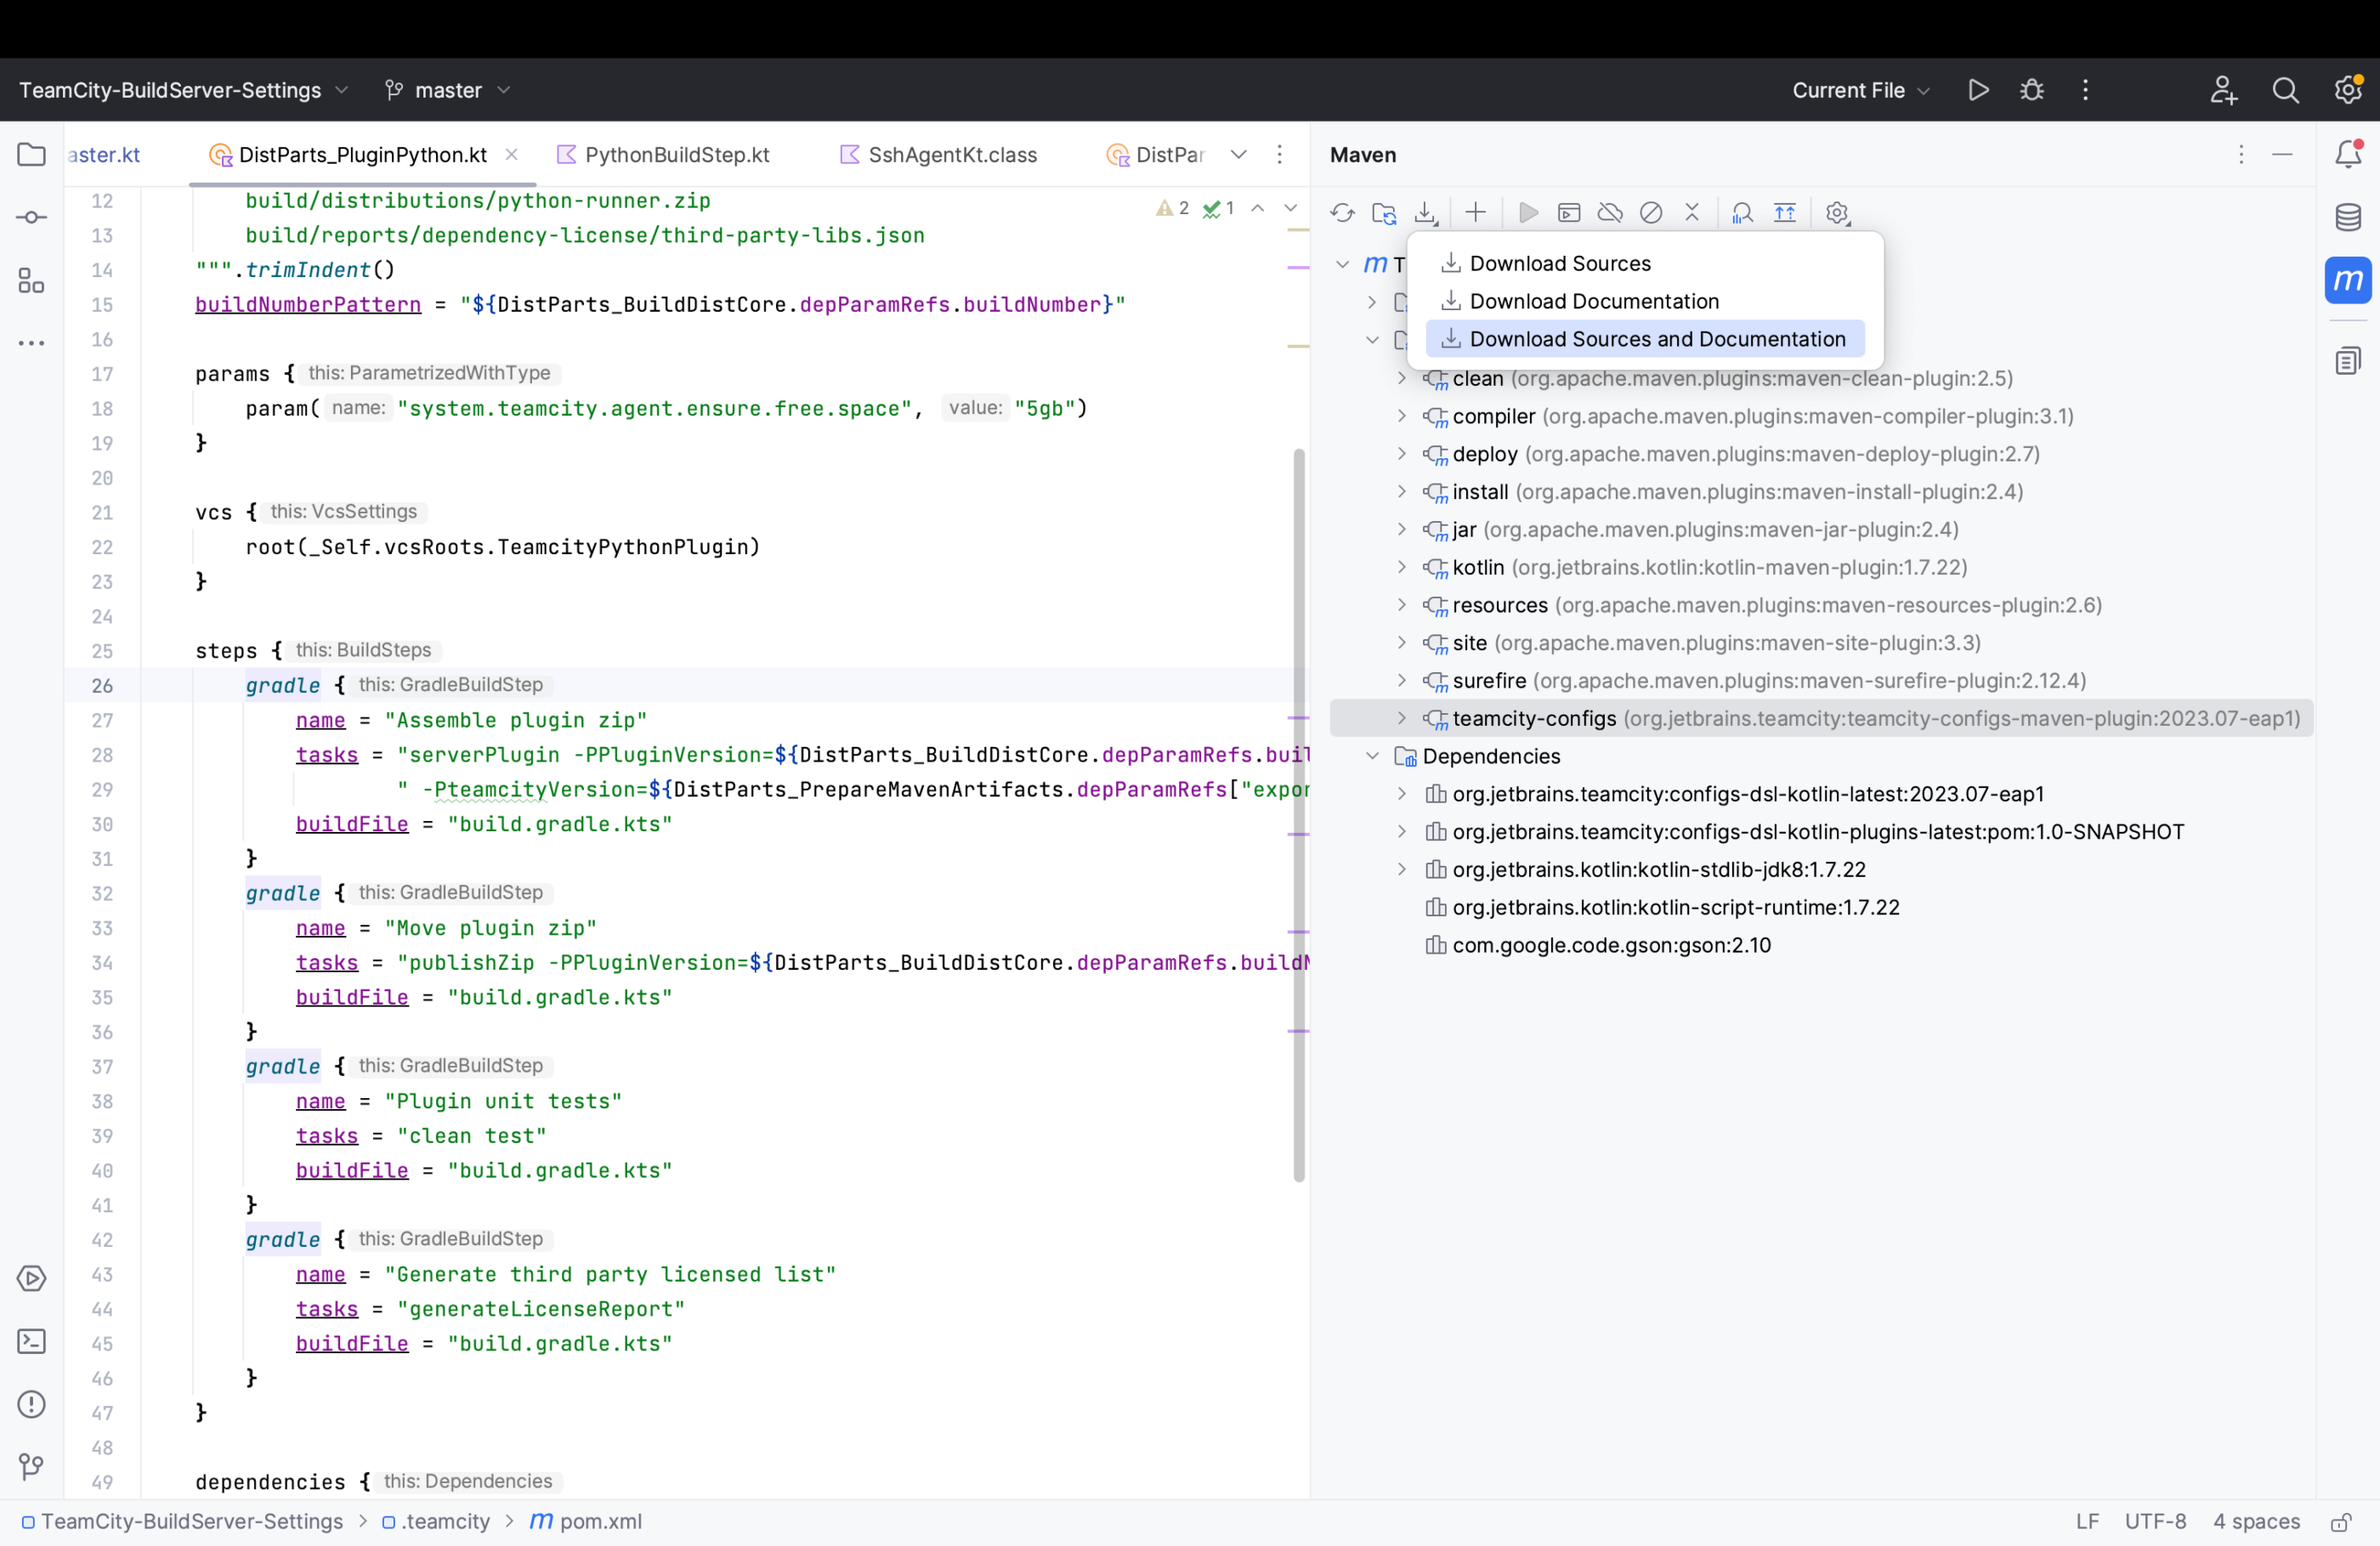
The Kotlin DSL documentation is available right from IntelliJ IDEA (both Ultimate and Community editions). You can access it by going to Maven Tool Window | Download Sources and Documentation.
Another way to access the Kotlin DSL documentation directly from your IDE is to run the mvn -U dependency:sources command.
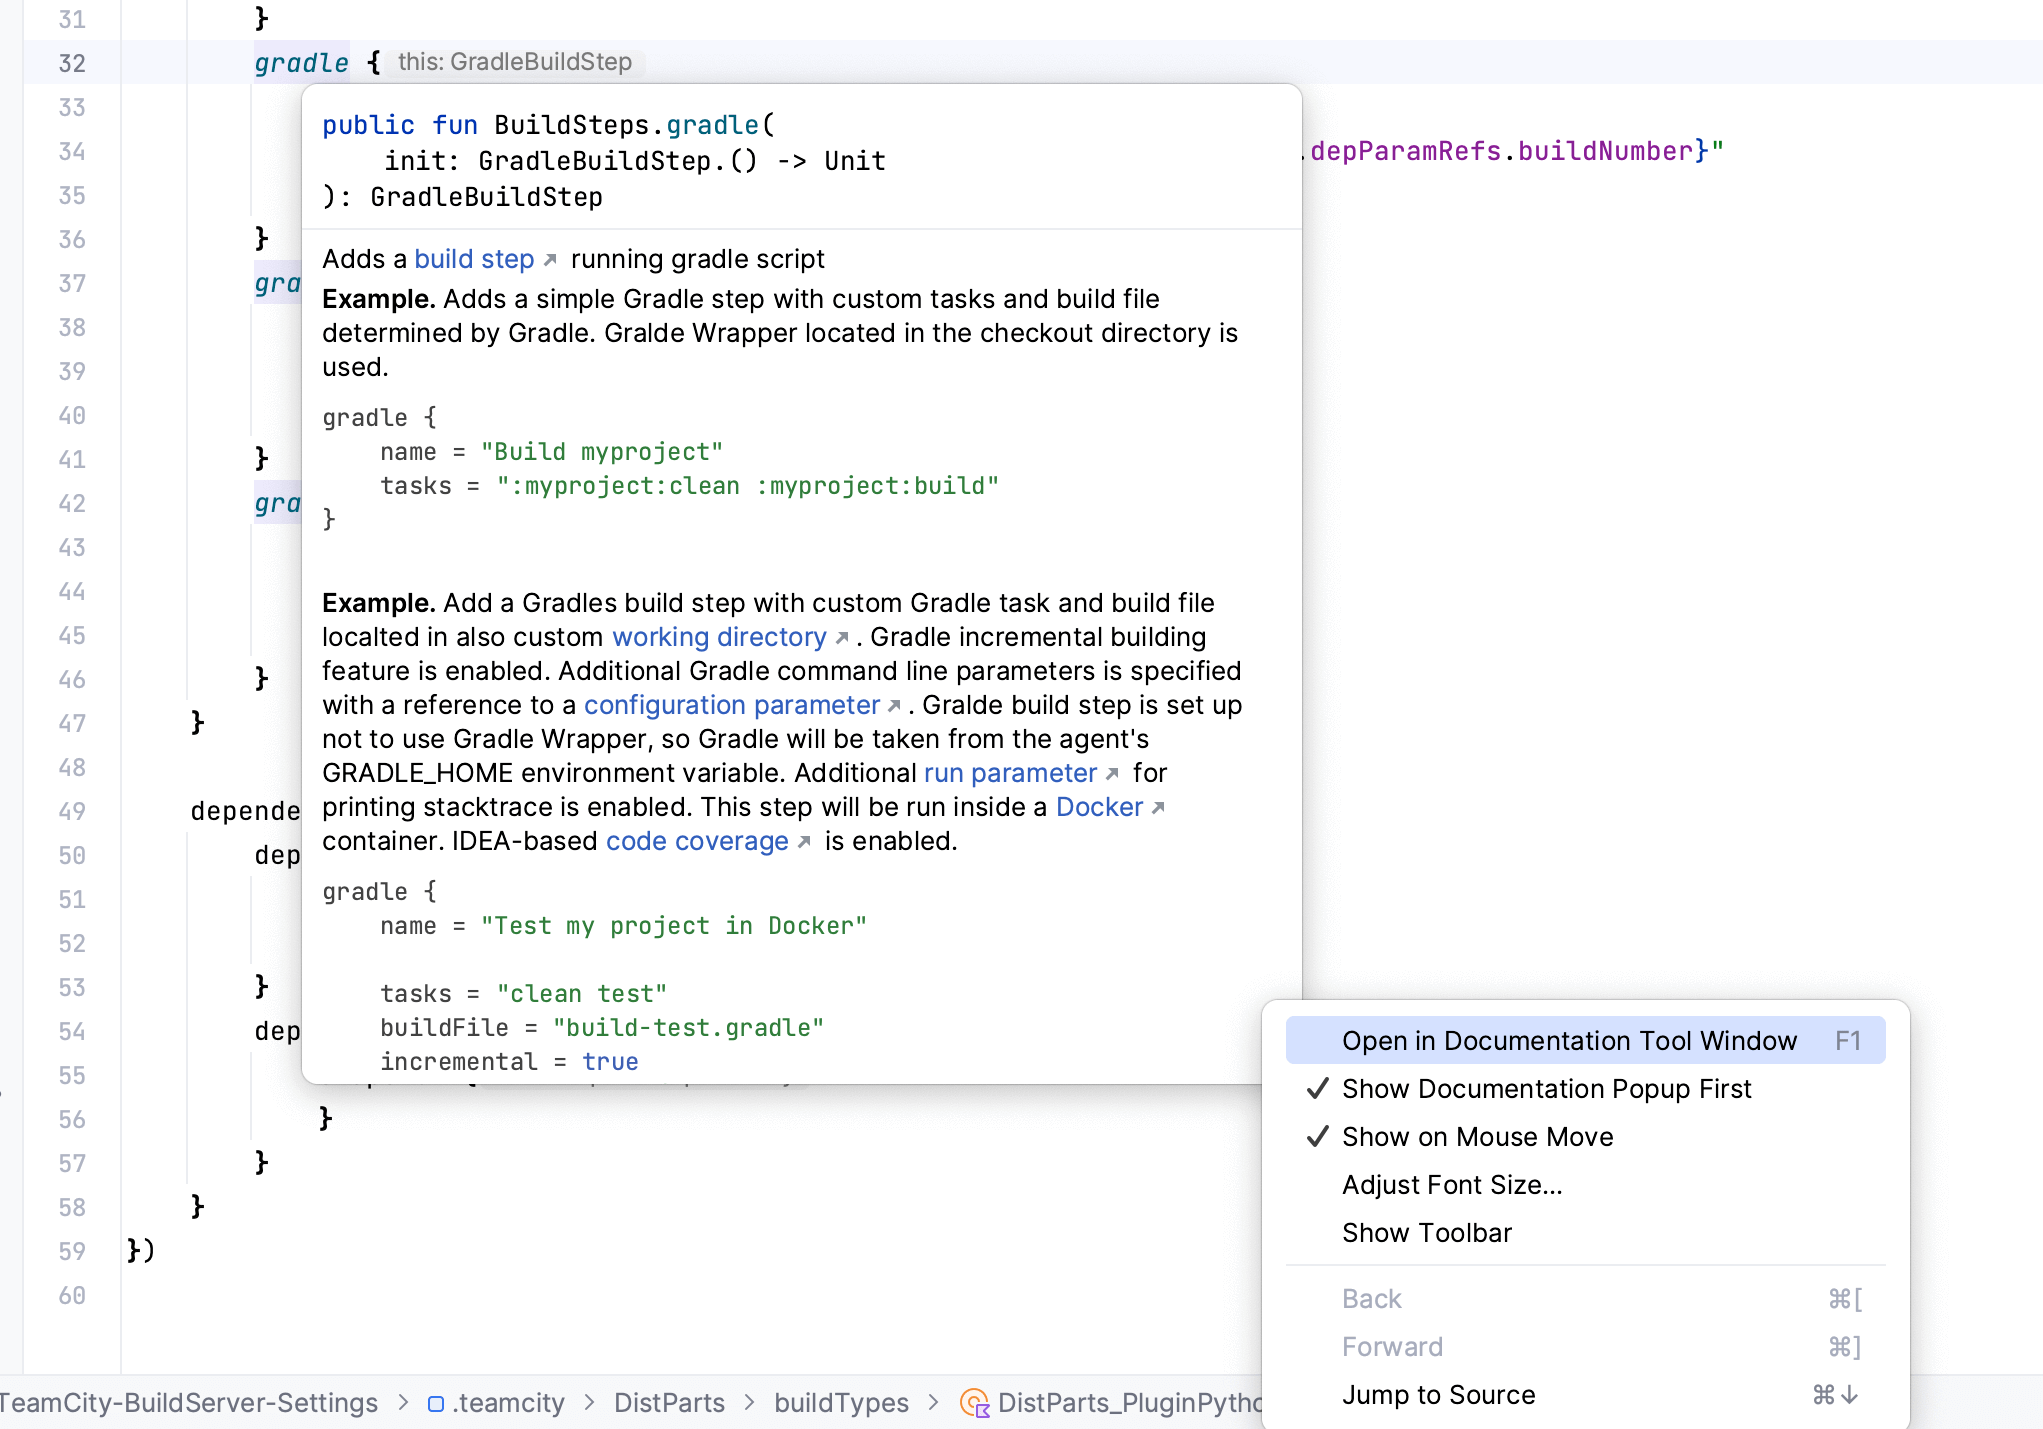
The documentation’s context and examples change when you click on an entity (for example, a build step or a trigger). The information is displayed either in a popup window or in the panel on the left, depending on the settings you’ve selected.
There are a few different ways to open the Kotlin DSL examples from your IDE:
Pressing F1 on Mac or Ctrl + Q on Windows. Refer to this section of the IntelliJ IDEA documentation for more details.
Clicking on the name of an entity (such as a build step or a command). The examples will open in the menu on the right-hand side of the window.
Simply hovering over an entity to access the in-line information window.
How this feature is helpful
Using Kotlin DSL examples can save you time when configuring your pipelines as code. The examples also make it easier to discover all of the things you can do when configuring builds, in addition to helping you identify the scenarios that TeamCity can support.
Working with the Kotlin DSL examples can be a particularly great option when you are just getting started, as they provide a solid foundation on which to build your understanding of the Kotlin DSL.
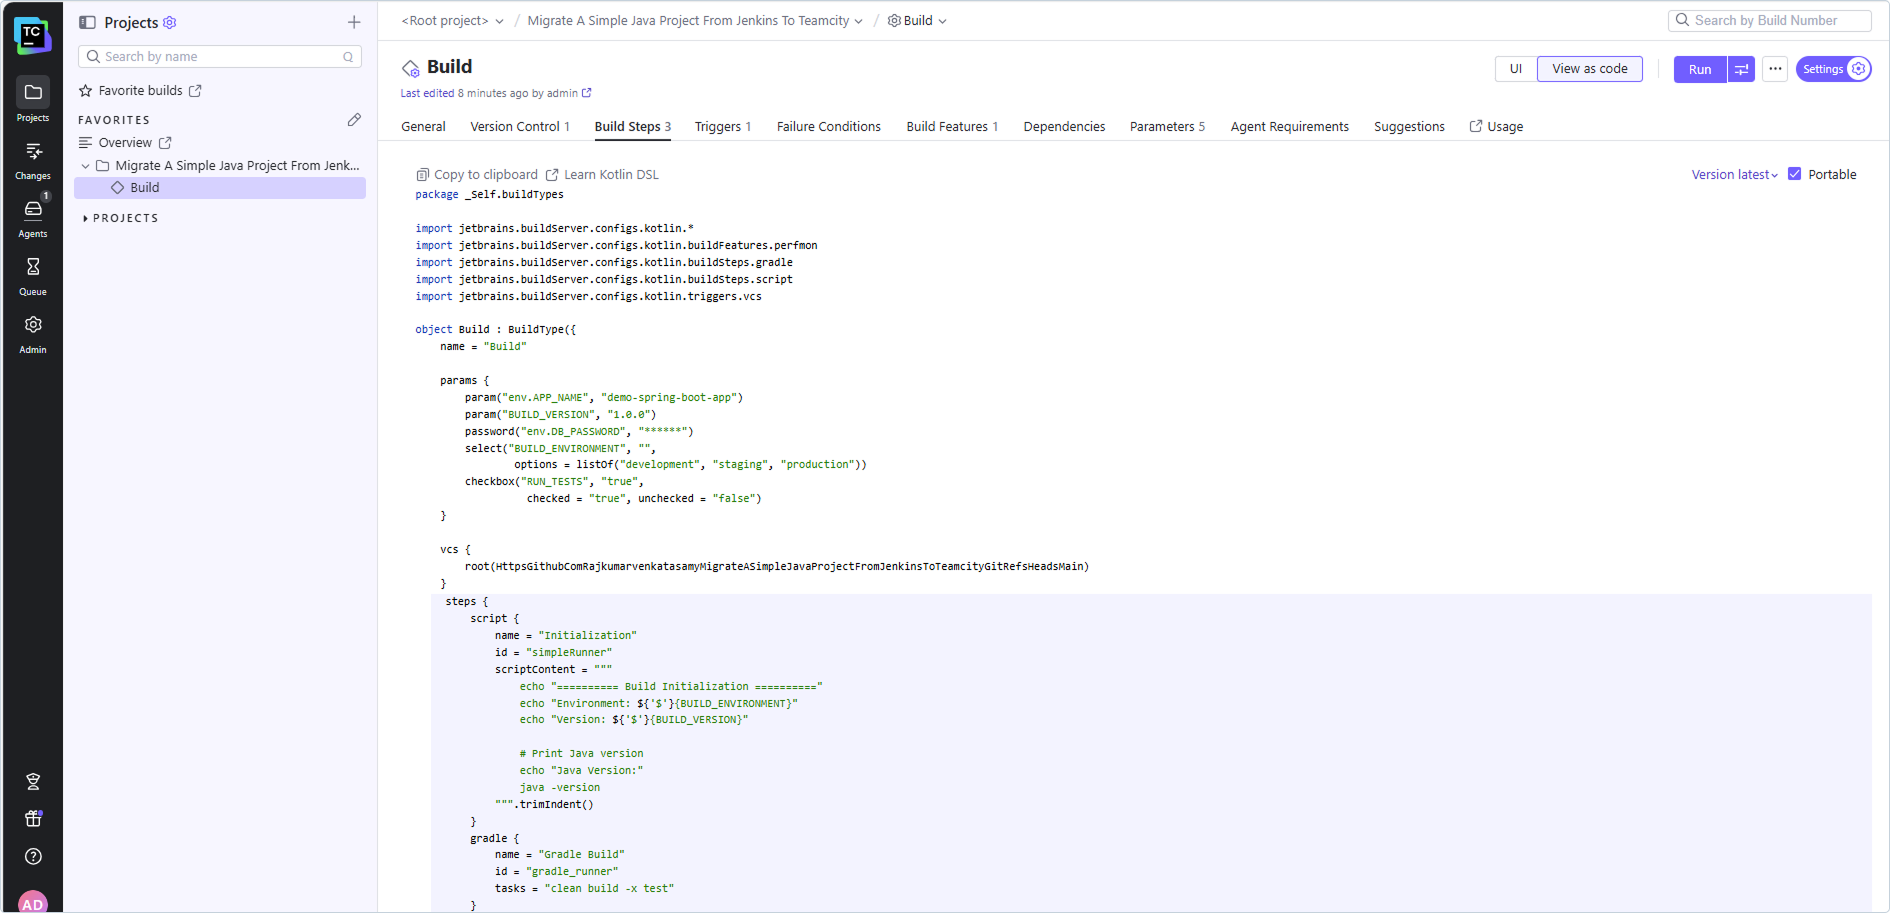
TeamCity also provides you with an option to view your settings as code with the help of the View as code button, which is available on the build level. This displays your settings as code that you can copy and paste to your codebase.
If your project can’t be configured via the UI and you’d still like to experiment with the View as code feature, consider setting up a sandbox project on your TeamCity server. It will give you a chance to play around with different TeamCity features and see how they look in the Kotlin DSL.
Further resources
If you’d like to learn more about using the Kotlin DSL for TeamCity, here are some additional resources that you might find useful:
Do you have any questions or comments about how we can improve the Kotlin DSL examples and documentation? We’d love to get your feedback! Feel free to share it in the comment section below.
There are plenty of options available when it comes to selecting a CI/CD tool for your organization. A direct feature comparison on third-party websites like G2 can help you get a solid understanding of a tool’s core functionality.
However, you might still find it challenging to understand whether a tool is capable of meeting your specific requirements, how easy it is to use, or how compliant it is with your industry regulations.
In this blog post, we offer general guidelines for selecting an appropriate CI/CD solution and delve into how TeamCity fits into this framework. We hope it will help you make an informed decision when choosing the best CI/CD tool for your organization.
Choosing the right CI/CD tool for your needs and goals
The needs for a CI/CD solution can vary greatly between teams, and a tool that serves one team perfectly might not be as suitable for another.
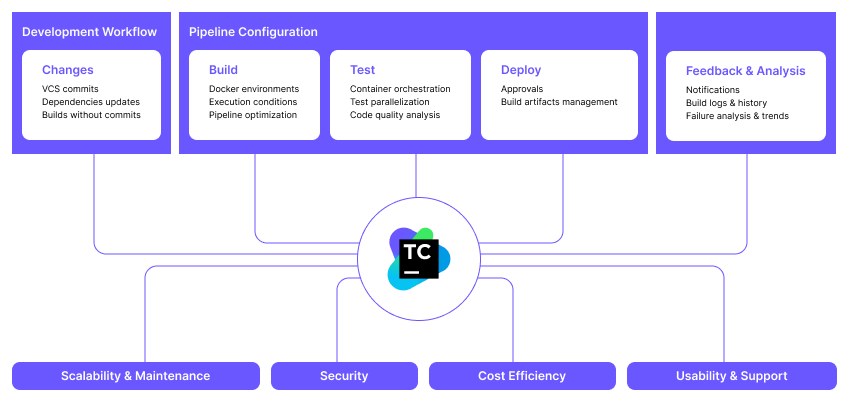
Here, we suggest seven main factors to consider when choosing a CI/CD solution for your team.
Development workflow. The CI/CD tool should integrate smoothly into your development workflows without requiring you to write too many custom scripts or plugins.
Pipeline configuration. The CI/CD tool should offer a flexible setup for environments, security checks, approvals, and more to allow the proper flow of artifacts and dependencies between build steps.
Feedback and analysis. The CI/CD tool should provide comprehensive feedback on multiple levels, from error messages to infrastructure performance, to ensure fast problem resolution and an uninterrupted delivery process.
Scalability and maintenance. Moving from one CI/CD tool to another can take months of work, which makes it very important to use a solution that will cover all of your future needs from the outset.
Security. It’s critical to prevent malicious actors from stealing your source code, hacking into your infrastructure, or compromising the end product.
Cost efficiency. When evaluating a CI/CD solution, it’s not only crucial to look at the price of a license or a subscription but also the operational and maintenance expenses.
Usability and support. Every developer, even without prior experience in continuous delivery, should be able to understand how their project is built and deployed, and how to effectively use the CI/CD tool to deliver changes faster.
Hosting model. Depending on your company’s needs, you might consider using a cloud or self-hosted solution. Both options have their advantages, so the final choice entirely depends on your specific needs.
All modern solutions offer essential features, such as Docker support, configuration as code, or automatic building of pull requests. For smaller projects, the differences between these solutions may not be as significant.
However, as your team grows and your workflows become more complex, it becomes increasingly difficult to set up the pipelines correctly and ensure they function as intended. In such cases, your experience with different CI/CD tools may vary greatly.
When evaluating a continuous integration tool, it is important to understand to what extent the tool can be customized to your workflow, and to what extent your team will need to adjust its processes to the tool. Consider the following aspects:
Diversity of your change workflows
Your team may require the ability to build every pull request, run the pipeline when someone commits to a specific branch, or trigger a build when a particular user changes files within a particular directory.
Sometimes, you may need to run the build pipeline without committing changes to the repository to ensure that you never commit broken code and avoid negatively affecting your team members’ efforts.
Your code may be distributed across multiple version control systems (VCSs) of different types or live in a monorepo. You may need to rebuild and redeploy the application whenever an external dependency, such as a Maven package or a Docker container, is updated.
By carefully evaluating a CI/CD tool’s support for your specific change workflows, you can ensure that the tool is a good fit for your team and minimize the need for changes in your own processes.
Docker and non-Docker workflows
While Docker can provide a convenient and efficient approach to building many types of applications, there are situations where running on an actual OS is necessary. For instance, if your application relies on integration with a hardware component that cannot be accessed from a Docker container, you may require an OS-based workflow.
Similarly, a Docker-based workflow may be insufficient for your team’s needs if your software requires interaction with an OS, such as when developing a system driver or a Windows service.
When choosing the best CI tool for your team, evaluate your specific project requirements and consider the advantages and limitations of both approaches.
Team maturity
Teams just beginning their journey with continuous integration may be more flexible in adapting their workflow to fit a particular solution. Thus, tools with fewer configurable options may provide a simpler and more streamlined user experience.
In contrast, highly skilled teams that precisely understand their needs may find all-inclusive DevOps platforms limiting, as these solutions might not offer the required level of flexibility and customization.
Ease of migration
When selecting a new CI/CD tool, ease of migration should be one of the key considerations. In many cases, it may be simpler to migrate to a standalone CI/CD tool rather than to a complete DevOps platform. This way, users can migrate in batches, you’ll have to write fewer manual integrations, and it will minimize disruption to your development workflows.
Organizational aspects
It’s vital to consider the culture and policies of your organization, particularly if teams are encouraged to select their own development tools.
Keep in mind that some team members may resist changes to their workflow, especially if they are comfortable and familiar with their current tools.
Development workflow support in TeamCity
TeamCity is an excellent fit for the following workflows:
Support for multiple VCSs.
Ability to run CI/CD processes without committing.
Granular control of changes (filtering by branches, usernames, file masks, etc.).
Trigger-defined parameters.
Comprehensive API to integrate with other tools.
While it may be tricky to choose between the streamlined experience of a platform and the flexibility of a standalone tool, the good news is that one doesn’t necessarily prevent you from using the other.
Since it’s common for teams to use multiple CI/CD tools concurrently, you might as well use a combination of a standalone solution and an all-inclusive DevOps platform as long as there’s proper integration between the two.
Pipeline configuration
Every team has its own unique workflow and requirements, which makes using a customizable CI/CD tool that fully meets your needs vital. Here are the different types of pipeline configuration that you might consider when choosing a CI/CD tool.
UI and code-based configuration
Some tools offer a UI-based configuration approach that provides an easy way to get started and maintain the setup, as the pipelines can be configured without any special knowledge.
All modern tools support configuration as code, which gives you a versioned configuration history.
Many tools use YAML configurations, which provide a very straightforward way to automate the building and testing of simple apps. However, managing YAML files can become increasingly difficult as the team and infrastructure become more complex.
For large-scale projects, it might be more effective to configure CI/CD using a fully-fledged programming language, which allows using loops, conditional statements, and other language constructs. In addition, it makes it easy to write the configuration code in an IDE and take advantage of its refactoring and debugging features.
Workflow customization
Customization is a critical aspect of selecting a CI/CD tool, as it allows teams to create pipelines that match their specific build and deployment workflows.
Depending on the trigger event, such as a code commit, a dependency update, or a scheduled trigger, teams may want to customize the build environment, scope of testing, Docker image tag, and other pipeline components.
If you need to execute specific steps sequentially on the same build agent (for example, you might want to start a Windows service and then run a build on the same system), the chosen CI/CD tool should provide the ability to set this up exactly as needed.
Environment configuration
When selecting a CI/CD tool, it is essential to consider the level of customization it provides in terms of environment configuration. Specifically, teams should be able to choose the build environment that best fits their requirements, whether using Docker containers, cloud build agents, bare metal servers, or hybrid options.
As discussed in the Scalability section above, there are various optimization techniques that can help teams to complete builds faster and shorten the feedback loop.
One key optimization technique is the ability to cache dependencies, which can help minimize build times by avoiding having to download and install dependencies every time a build is run. Additionally, the ability to reuse build artifacts can further reduce build times, as previously-built components can be reused in subsequent builds.
Parallelizing tests across multiple build agents is another effective way to optimize pipelines in large projects. By spreading tests across multiple build agents, teams can reduce the time required to run all tests, helping to shorten the feedback loop and ensure that issues are identified and addressed more quickly.
💡Parallel tests revolutionized how we develop and test TeamCity. Our own integration tests have become over 10x faster, dropping from four hours to about 20 minutes.
Artifact management
Producing and propagating artifacts is essential to any CI/CD pipeline. Artifacts allow your builds to “communicate” and pass the data from one build to another.
By choosing a CI/CD tool that can store artifacts, you can store the data produced by your builds for further analysis and debugging.
Feedback and analysis
The primary purpose of CI/CD is to shorten the time it takes to receive feedback on the changes you make to your software. The most actionable feedback is the one that is directly tied to specific code changes and provides information about the status of builds and deployments, as well as changes in performance and quality metrics.
When evaluating a CI/CD solution, the following aspects must be considered:
Analysis of build results
CI/CD tools should provide a detailed analysis of build results, including information on failed tests, build times, error logs, and other key metrics. This information should be easily accessible and presented in a way that allows developers to identify and address issues quickly.
Trends
It is important for CI/CD tools to provide trend analysis capabilities, allowing teams to track changes in build and deployment performance over time. This can help teams to identify patterns and trends and proactively address potential issues before they become more serious.
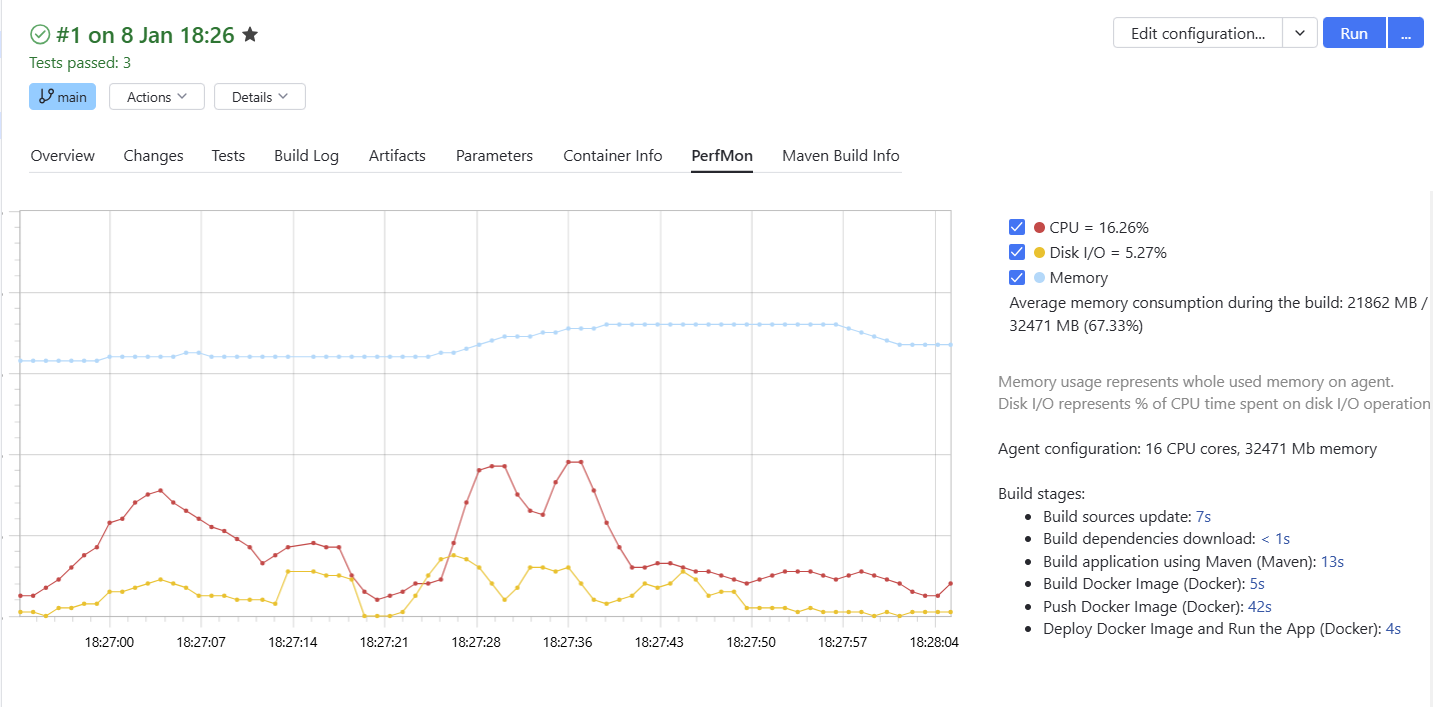
Performance monitoring
To identify bottlenecks and resolve issues that affect the efficiency of the CI/CD process, it is critical to be able to profile the performance of build agents and identify the need to provision more resources to the build infrastructure.
It’s important for a CI/CD tool to be able to analyze and detect flaky tests. To shorten the feedback loop and speed up your development process, look for a tool that can identify flaky tests for you and highlight them in the test results.
Scalability and maintenance
Software projects tend to grow in size and complexity. A reliable CI/CD system must be able to handle this growth and keep pace with the growing number of pipelines, builds, users, roles, and workflows.
To ensure that your team is never held back, the system should be able to efficiently manage resources and be equipped with monitoring and maintenance tools to resolve any issues that arise quickly.
The following factors will help you understand the level of scalability required for your team.
User management
In small-scale projects, it’s usually sufficient to have basic role-based access rules that define who can trigger builds, view build results, or modify the pipeline configuration. Large teams require more advanced features, such as LDAP integration or single sign-on (SSO) support, two-factor authentication, project hierarchy, granular permission management, approval workflows, and audits.
As the frequency of commits and the complexity of workflows increases, it becomes important to utilize the resources of the CI/CD efficiently. This can be done by reusing build artifacts and minimizing the number of unnecessary rebuilds, reordering build queues, parallelizing tests, and via other similar features.
Project templates
The larger your organization is, the more you will benefit from using project templates. By standardizing typical workflows, you can significantly reduce the effort required to create and maintain pipelines, improve collaboration between teams, prevent misconfigurations, and increase the security of your CI/CD pipelines.
In this case study, Gearbox, an award-winning game development company, shares how they were able to streamline their CI/CD processes and standardize their CI/CD practices with the help of TeamCity’s reusable project templates.
As the number of projects grows and the demand for computing resources increases, it becomes more challenging to scale the build infrastructure and mitigate the risks of potential downtimes.
Typical requirements of large companies include automated provisioning of build agents (such as by integrating with cloud platforms) and the ability to organize build agents in pools for easier management.
Enterprise-level solutions pay a lot of attention to high-availability features, such as the ability to run multiple application servers in a clustered environment and smart load balancing.
Maintenance and upgrade
To identify and resolve issues in the CI/CD setup, administrators should have the monitoring and logging tools and be able to increase resources, implement caching mechanisms, or update artifact retention policies when needed.
Special attention should be given to upgrading the solution. Some CI/CD tools rely on external plugins so heavily that upgrading them without breaking existing functionality may be difficult or even impossible.
A scalable CI/CD solution may not be crucial for small teams and projects with limited complexity. However, as the size of the team and the complexity of the project increase, it becomes one of the most critical aspects of the software development process.
How TeamCity supports scalability
TeamCity can support projects of any size, including projects with a vast amount of dependencies. It can scale automatically during periods of high load. One instance of TeamCity Server can stably work with 1,000+ build agents.
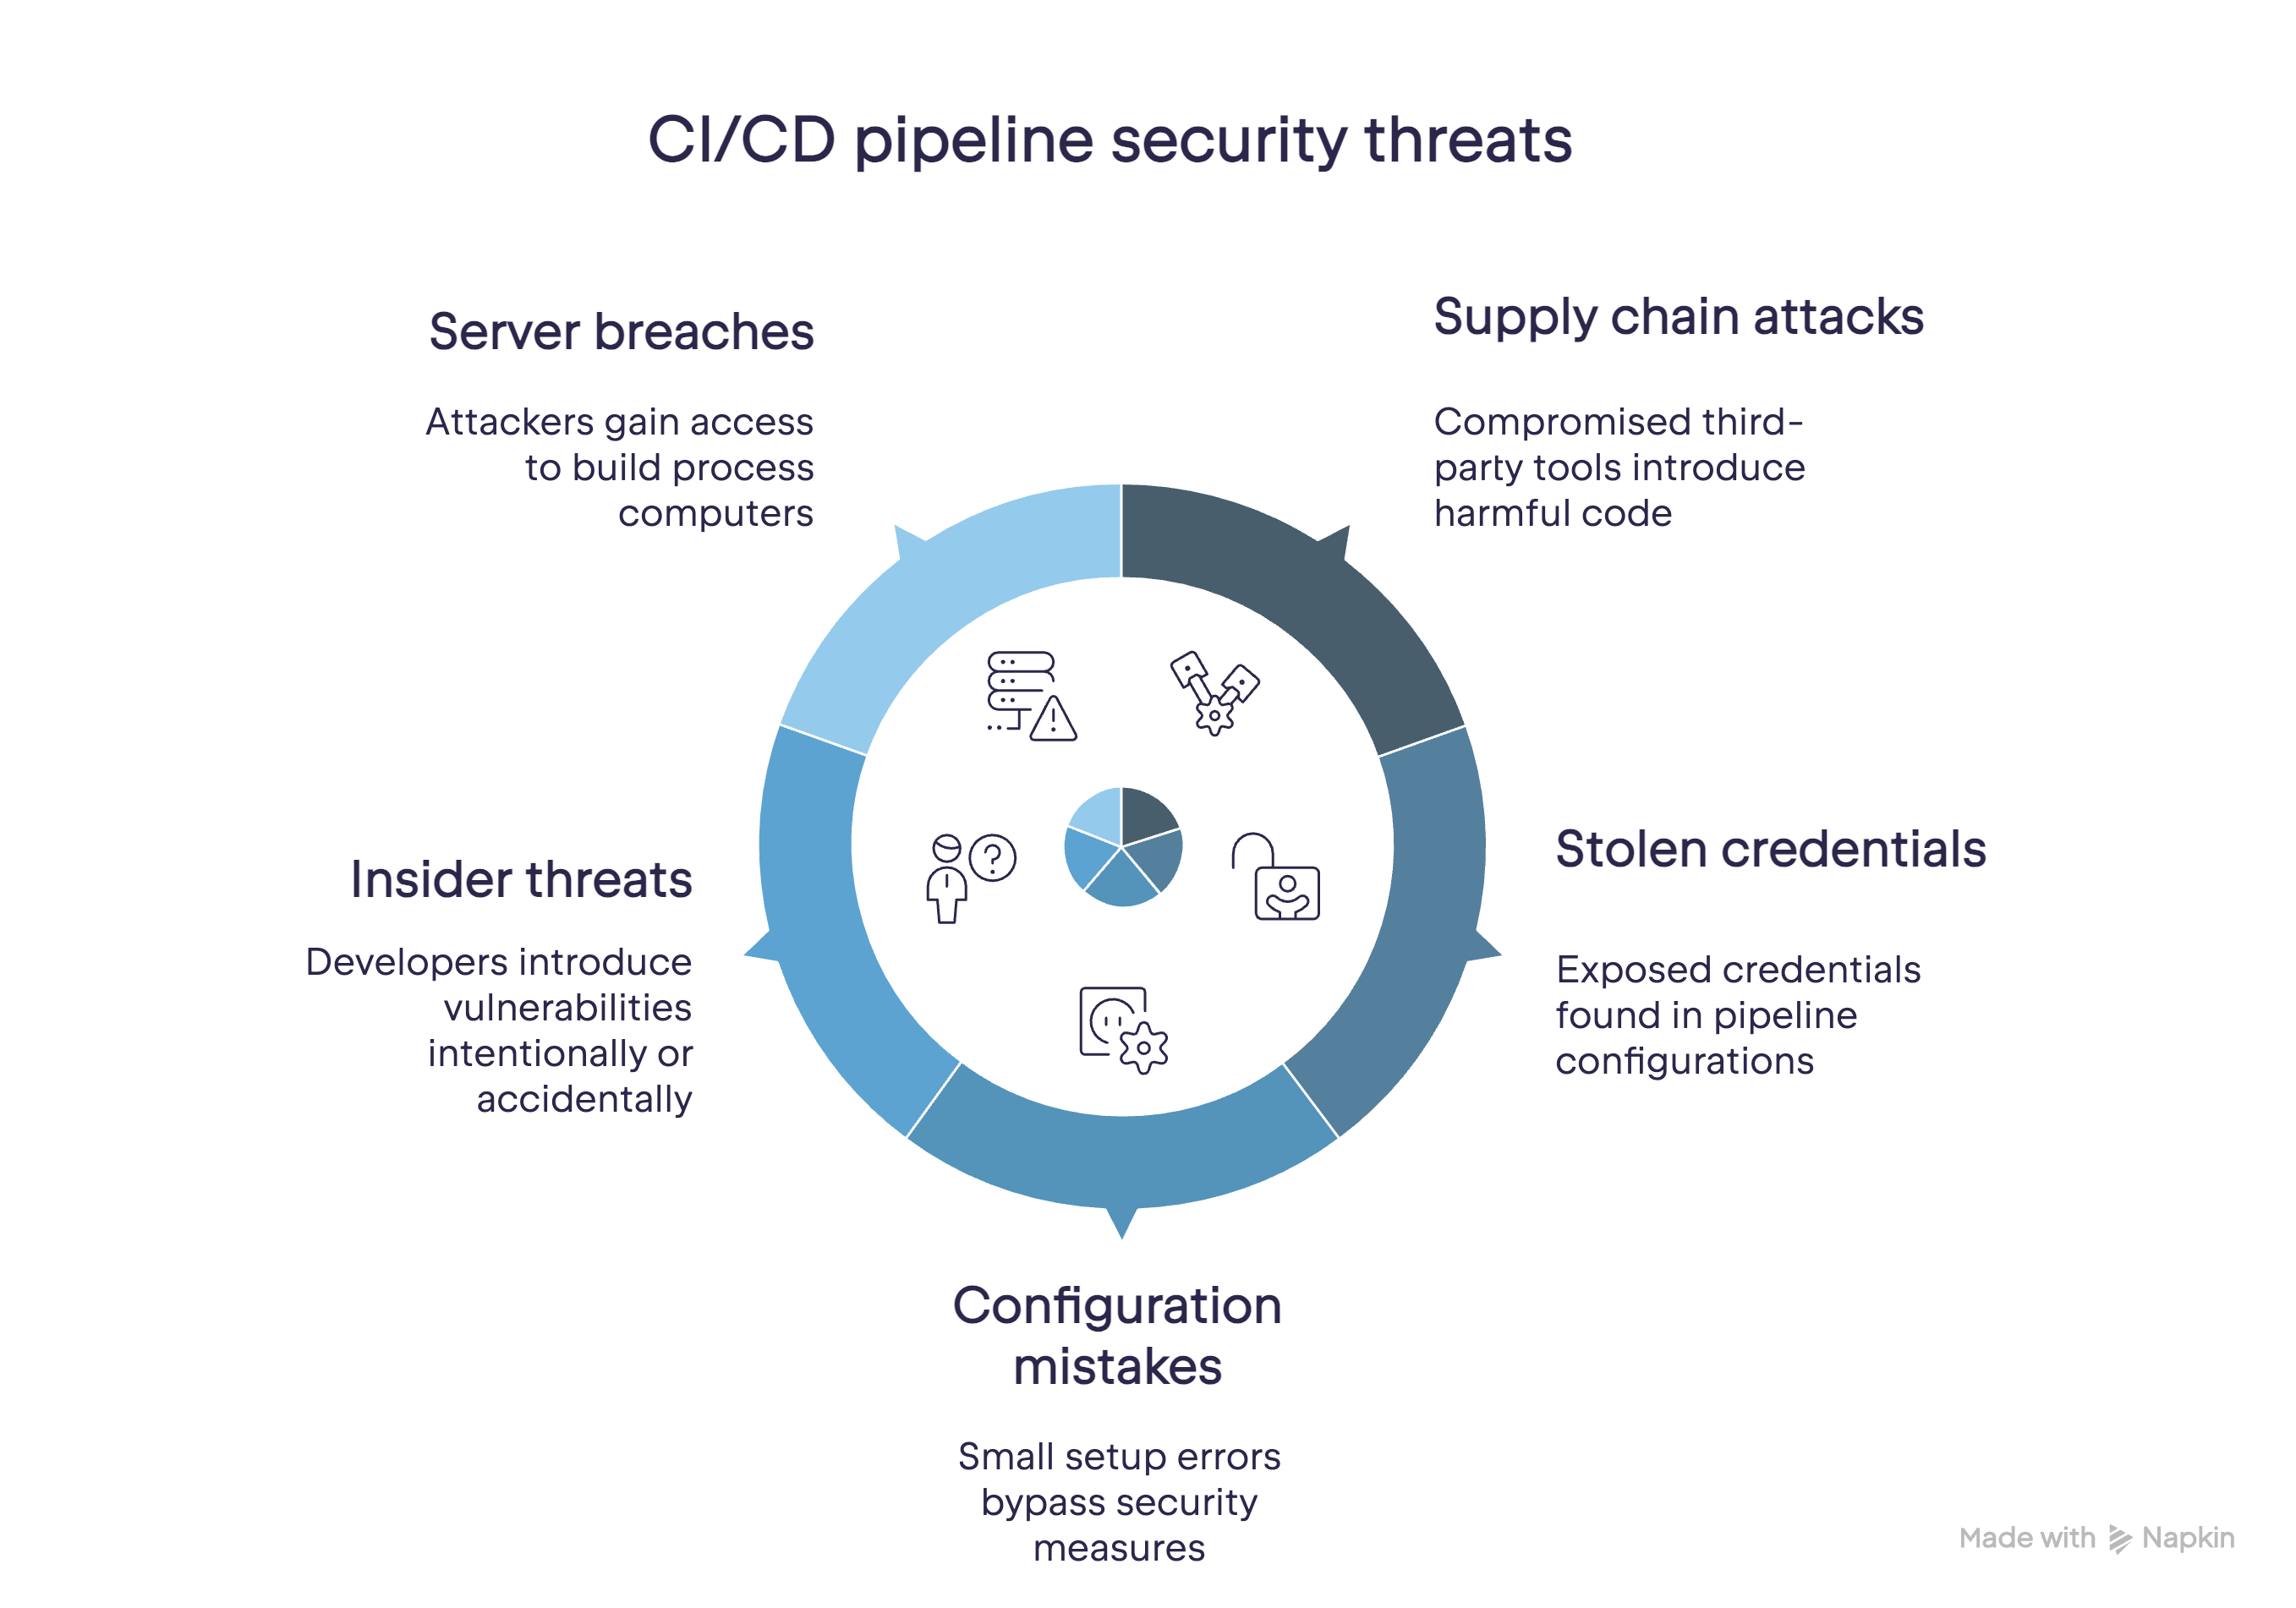
Security is a major consideration for any software development process, and it is especially critical for CI/CD, as CI/CD tools are given trusted access to sensitive data and systems.
When evaluating a solution, look at the security features from two main perspectives:
Security of the service. With new threats and vulnerabilities emerging every day, the solution must ensure that potential attackers can’t get access to your source code, secret keys, build infrastructure, or build results.
Security of the end product. Many CI/CD tools allow integrating security checks into the build pipelines to ensure that the resulting software doesn’t have vulnerabilities that can be exploited.
Some teams tend to prioritize speed and efficiency over security, which can lead to shortcuts and neglect of security best practices. Integrated platforms generally provide an easier way to secure CI/CD at the cost of “vendor-locking” you into their ecosystem and workflows.
As pipelines become more complex and team sizes grow, the price of a license or subscription can become less important compared to other factors that can affect the effectiveness of the CI/CD system:
Statistically, by reordering the build queue and minimizing redundant builds, teams can save at least 30% of the build time and associated costs.
The more tools and services your CI/CD supports out of the box, the less the chance you’ll have to write and maintain custom scripts and external integrations. This can drastically affect maintenance costs.
Additionally, most teams have peak periods (usually during release times) when any failures of the CI/CD tool can significantly impact the company’s business. This is one of the challenges that can hardly be evaluated without having actual experience with a particular CI/CD solution. Still, it is possible to understand how it handles such issues by reading reviews and feedback from other teams regarding work on similar tasks.
Ultimately, the total cost of ownership of a CI/CD solution depends on your team’s specific needs and requirements. As a general rule, it is prudent to consider the following factors:
Integration costs
Integrating CI/CD with version control systems, issue trackers, build and test frameworks, deployment automation systems, and other tools can be very time-consuming and expensive.
Maintenance costs
Every CI/CD solution requires allocating resources for running regular security audits and keeping the underlying infrastructure up to date, diagnosing and eliminating bottlenecks. In many companies, supporting these processes requires an entire team.
CI/CD efficiency
If your builds are constantly sitting in the queue and you are not getting rapid feedback, this defeats the whole purpose of a CI/CD solution. Such features as dynamic scaling in the cloud, re-using of builds, and test parallelization significantly impact developer efficiency in large companies.
Feedback
To achieve efficient and productive software development, it is essential to have a feedback loop that is not only timely but also actionable. When a build fails, developers should quickly identify the root cause of the issue and see a clear path to a resolution. Often, there is an observable time between being notified of a build failure and fully understanding what needs to be fixed – and this is where a reliable CI/CD tool can provide immense value.
By analyzing build logs and providing precise information about the issue, the best CI/CD tools can help developers fix any issues quickly and confidently, leading to faster feedback loops and increased overall productivity.
Factors that reduce TeamCity’s cost of ownership:
Licensing costs
Infrastructure costs
Integration costs
Maintenance costs
Usability and support
Finding the optimal balance between functionality and user experience is a constant challenge for vendors of CI/CD solutions. When evaluating software usability for your team, you should consider the following factors:
UI consistency
As the size of projects increases, it becomes increasingly essential that your CI/CD provides the required functionality without adding unnecessary complexity. When evaluating a solution, ensure that the most critical features are provided by the vendor, not developed by the community.
“One of the competitors had a very unfriendly UI. The feeling that people should have when they come into a CI/CD system is that it is very sturdy; it won’t break when I try to do anything in it. I think TeamCity has a very well-polished UI. You have confidence that it is a well-working system when you navigate it.” – Steve Fortier, Lead Release Engineer, Gearbox
External plugins can often introduce navigation issues, feature an unresponsive interface, have conflicting terms and icons, exhibit difficulty adapting to different screen sizes and devices, and lack proper documentation. Regardless of how experienced your team is, an inconsistent user interface will always result in reduced productivity.
Accessibility
If a CI/CD tool supports accessibility features such as screen reader compatibility, keyboard navigation, and high contrast mode, it’s usually a good indicator that it provides a good experience in general.
Documentation and support
Comprehensive documentation, tutorials, videos, and a supportive community can be essential for effectively using a CI/CD tool. As a rule of thumb, the longer the solution has been available on the market, the higher the chance that you will be able to resolve problems and obtain answers to your questions.
API
Depending on the specific requirements of your team and the workflow you want to implement, you may need to integrate your CI/CD with external tools. This experience can vary widely depending on the maturity of the API, the availability and quality of its documentation, and how rapidly it changes between versions of the software.
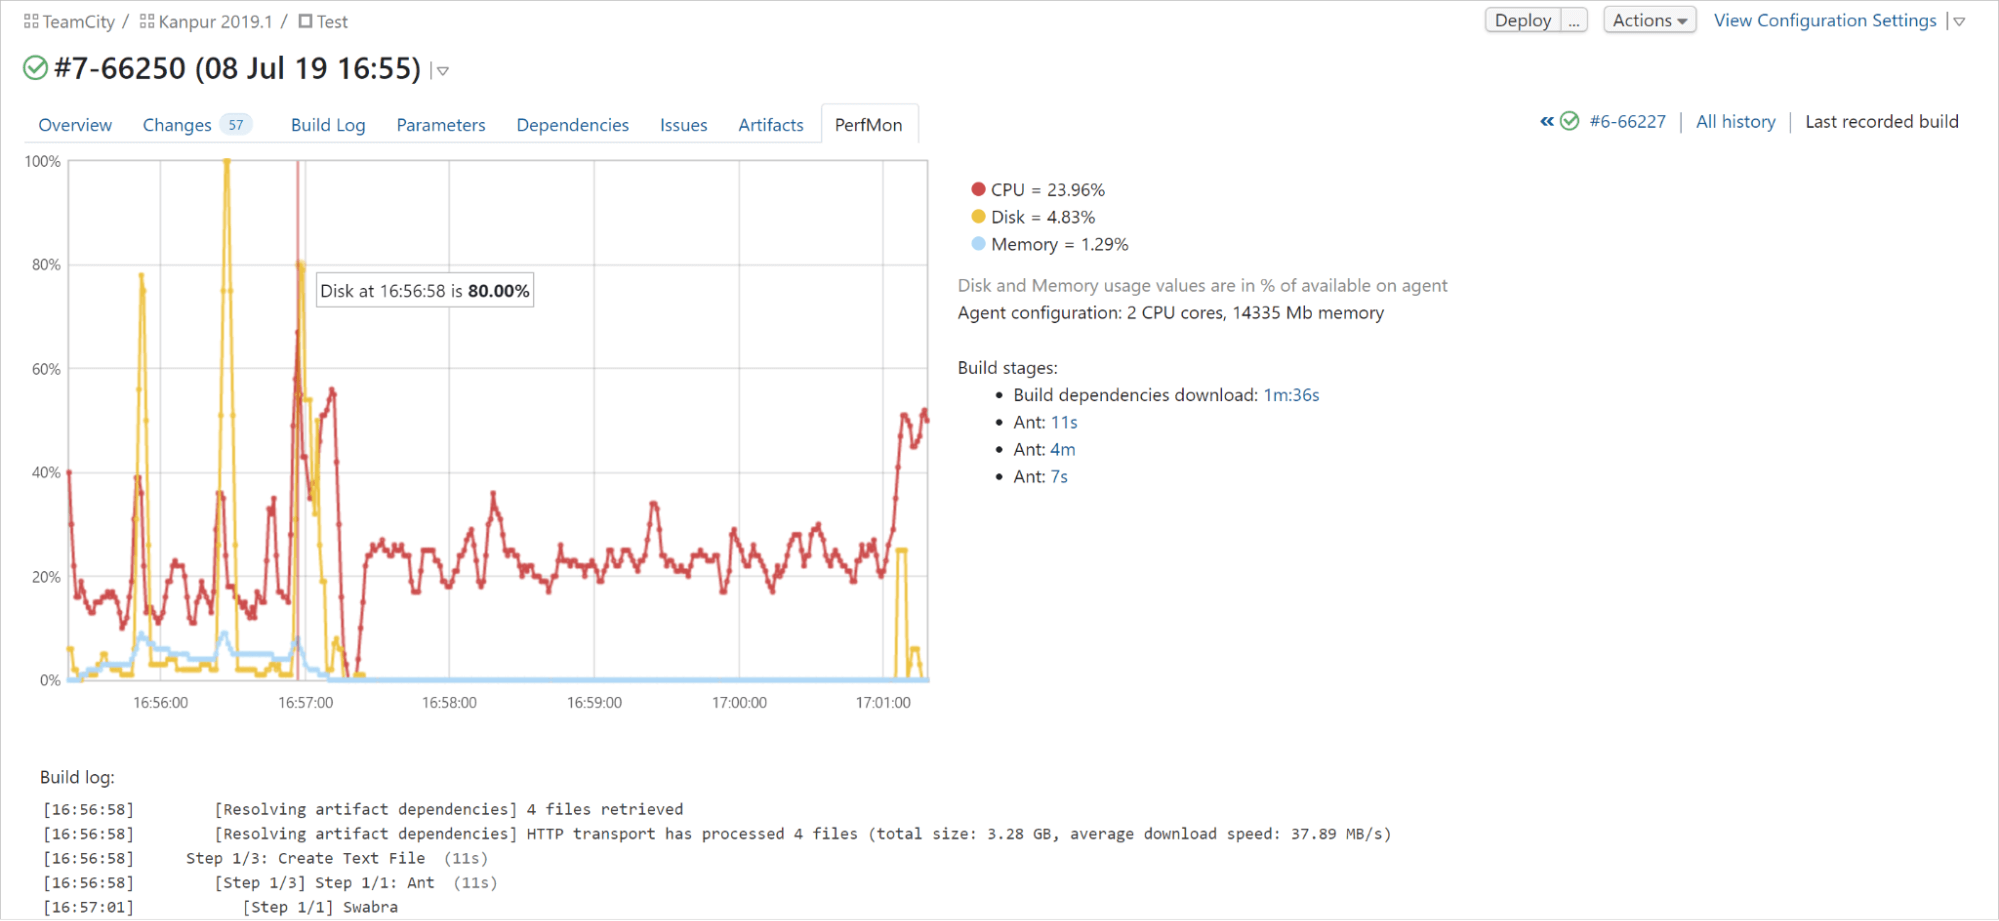
An intuitive user interface is vital in a CI/CD solution because it helps developers easily and quickly understand and use the solution, even when working with complex processes.
Example of TeamCity’s UI
Hosting model
CI/CD solutions can be roughly divided into two categories – cloud and on-premises options.
Meanwhile, on-premises CI/CD tools will enable you to host your CI/CD behind the security of your firewall, complying with the strictest security regulations and requirements.
Final thoughts
Choosing a CI/CD tool for your organization depends on many factors. In this blog post, we’ve provided you with the key factors you might want to consider when researching the best fit for your team or organization.
Feel free to share your questions or comments in the section below. We’ll be happy to answer them.
The recently released TeamCity 2023.11 comes with the long-awaited matrix buildfeature. Matrix build is a build that executes the same set of steps on different combinations of input parameters, producing a matrix with the result of every execution. This is a classic approach to testing code changes on different architectures and operating systems.
Matrix builds in TeamCity allow exactly this, while using the Fork-Join pattern under the hood. Let’s see how this works.
Applying the Fork-Join pattern to builds in TeamCity
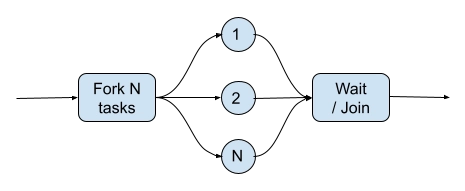
The Fork-Join pattern is a programming technique designed for situations where certain tasks can be done in parallel. You spawn a set of tasks/threads (fork), wait for those tasks/threads to be executed (join), and then combine all the results.
Let’s assume that we’d like to use the same Fork-Join approach for our builds in TeamCity. A natural choice would be to create several build configurations for the parallel activities and add a composite build that would have snapshot dependencies on all these build configurations.
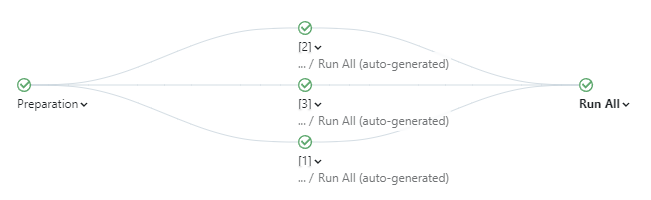
Here the Preparation build prepares something that can be used by the Task builds. Run All is a composite build that waits for all the tasks to finish.
If we’re using the Kotlin DSL, then we can create any number of such build configurations relatively easily. We might end up with something like:
import jetbrains.buildServer.configs.kotlin.*
import jetbrains.buildServer.configs.kotlin.buildSteps.script

version = "2023.11"

project {
   val tasks = mutableListOf<Task>()
   for (num in 1..3) {
       val task = Task(num)
       tasks.add(task)
       buildType(task)
   }

   buildType(RunAll(tasks))
   buildType(Preparation)
}

class RunAll(tasks: List<Task>) : BuildType({
   name = "Run All"

   type = Type.COMPOSITE

   dependencies {
       for (task in tasks) {
           snapshot(task) {}
       }
   }
})

class Task(taskNum: Int) : BuildType({
   id("Task$taskNum")
   name = "Task $taskNum"

   steps {
       script {
           scriptContent = """
               echo "Running Task $taskNum"
           """.trimIndent()
       }
   }

   dependencies {
       snapshot(Preparation) {}
   }
})

object Preparation : BuildType({...})
If we want to use a web interface, we’d probably first create a template and then base our Task build configurations on it. Obviously, using a web interface for setup will involve a lot more clicking, but in the end the result will be the same.
What does this have to do with matrix builds?
Let’s change our Kotlin DSL example by utilizing the matrix build feature:
You can see that our RunAll build configuration is now a normal / non-composite build that has a matrix build feature with a taskNum parameter, and this taskNum parameter is being used in the build step. There are no Task(s) and no snapshot dependencies on them; the only snapshot dependency left is Preparation.
When we trigger RunAll, TeamCity will analyze the matrix feature parameters and will create a new set of builds with the same settings as the triggered one, but each build gets its own value from the matrix parameter. The main build is then transformed into a composite one, and snapshot dependencies are added to the generated builds.
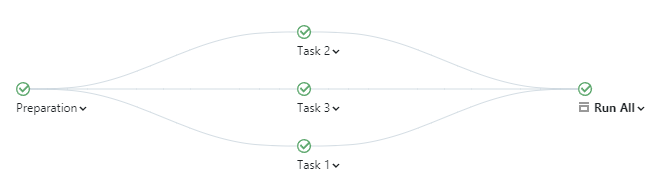
Essentially, the build becomes a build chain that resembles the same Fork-Join pattern:
All we had to do was to add a matrix build with a single parameter with multiple values and make our steps change behavior based on the value of the parameter (which we’d need to do in any case).
Another advantage is that the generated builds are being placed in the auto-generated build configurations, which are not being shown in the normal TeamCity build configuration views. This significantly reduces clutter. You can still navigate to the generated builds using direct links and investigate the build history there.
Since the matrix build is a composite build, all the results are being accumulated and shown in a single place automatically. For instance, if individual builds run tests, then all of them will be visible on the matrix build’s Tests tab. Moreover, if individual builds publish artifacts, the artifacts will also be combined into a single artifact tree and shown in the matrix build.
As you can see, matrix builds can be used to parallelize activities in your builds. For instance, you might want to split a single test suite into several smaller ones. In this case, you can set up a matrix build with a “suite” parameter, whose value might be a list of all these separate test suites. Subsequently, you simply feed this suite parameter value into your build step without generating any extra build configurations and without observing them constantly in the UI.
By the way, if you need to run different build steps depending on matrix build parameters, then you can use conditional steps.
This is a guest article by Kumar Harsh, draft.dev.
If you ship Android app releases frequently, you probably already understand the value of well-defined build, test, and deployment workflows. Without resilient, automated DevOps workflows in place, it can be difficult to maintain a high release velocity. Automating these through continuous integration and continuous deployment (CI/CD) can make your life a lot easier and allow you to detect bugs earlier and release faster.
JetBrains TeamCity is a CI/CD platform for building robust pipelines. It offers seamless integration with popular Android development tools and features a user-friendly interface for configuring build and test stages.
This article will show you how to set up a CI/CD pipeline for your Android project using JetBrains TeamCity. You’ll explore the key components of Android CI/CD pipelines and dive into configuring a few sample pipelines with TeamCity.
Understanding the Android CI/CD pipeline
An effective CI/CD pipeline for Android development contains all of the steps included in a standard DevOps pipeline and augments it with additional processes like artifact signing and auto-deployment to internal tracks on the Google Play Store. Here is a quick overview of all the steps involved in a typical Android CI/CD pipeline:
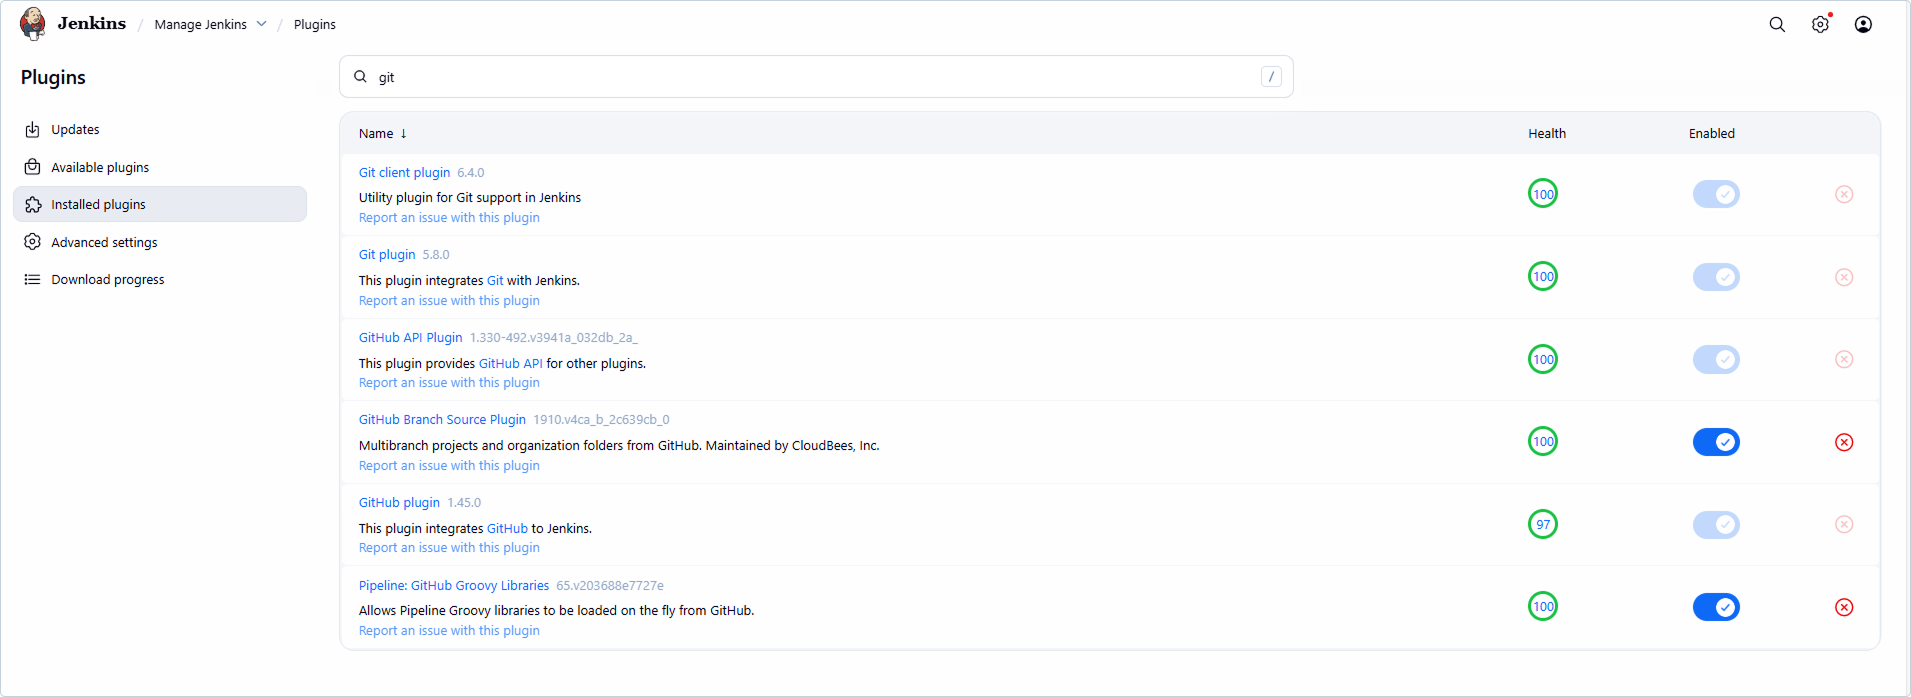
1. Code checkout and version control integration: The pipeline begins by fetching the latest code changes from your version control system (VCS), such as Git. If you’re using TeamCity, you’ll benefit from its integration with popular version control tools and automatic triggering of pipelines upon code commits or merges.
2. Build automation with Gradle: Gradle, the standard build tool for Android projects, takes center stage in this step. TeamCity executes Gradle commands to compile your code, assemble resources, and generate build artifacts. TeamCity’s build runners provide compatibility with different Gradle versions and customizable environments for build configurations.
3. Unit and integration testing for multiple Android versions/platforms: The next step involves running unit tests that verify individual code modules and integration tests (including UI tests) that check how different components interact. TeamCity allows you to configure multiple test runners and frameworks (e.g. JUnit, Espresso) and execute tests targeting various Android versions and platforms using emulators or device labs.
4. Static code analysis (featuring JetBrains Qodana) and code coverage reporting: Static code analysis helps identify potential bugs, security vulnerabilities, and coding style inconsistencies early on. TeamCity integrates with JetBrains Qodana, a static code analysis tool that offers features like code smell detection, complex code analysis, and integration with various programming languages, ensuring comprehensive code quality checks. Additionally, TeamCity can generate code coverage reports that indicate which parts of your code are exercised by unit tests. This helps developers focus on areas with weak coverage.
5. Artifact generation and signing (APKs and AABs): After successful builds and tests, the next step involves creating deployable artifacts. For Android apps, this typically involves generating signed Android Package Kits (APKs) or Android App Bundles (AABs). TeamCity allows you to automate the signing process within the pipeline using build steps.
6. Deployment to internal testing and production environments (Google Play, beta channels): CI/CD pipelines can automate app deployment to various environments. TeamCity allows configuration for deploying to internal testing platforms or directly to production channels on Google Play.
7. Continuous monitoring and feedback loops: A robust CI/CD pipeline doesn’t end with deployment. TeamCity integrates with monitoring tools, enabling you to track app performance, identify crashes, and gather user feedback. This feedback loop allows developers to react quickly to issues and continuously improve their app’s quality.
Building the pipeline with TeamCity
Now that you’ve explored the general CI/CD pipeline structure, let’s dive into building one using TeamCity. The following sections guide you through setting up TeamCity, creating build configurations tailored to your Android project, integrating automated testing, and finally, configuring packaging and deployment of your app.
To keep things simple, this tutorial uses the cloud-hosted version of TeamCity, which comes with a fourteen-day free trial. You can sign up for it using your GitHub, GitLab, Bitbucket, or Google Account, or by using the old-school combination of your email address and password. Make sure to activate your trial or subscription before moving to the next step.
However, you can also use TeamCity Cloud with self-hosted build agents or even TeamCity On-Premises for the purposes of this tutorial. Keep in mind that using self-hosted build agents or TeamCity On-Premises would require you to install Android SDK on your agents separately.
Setting up TeamCity
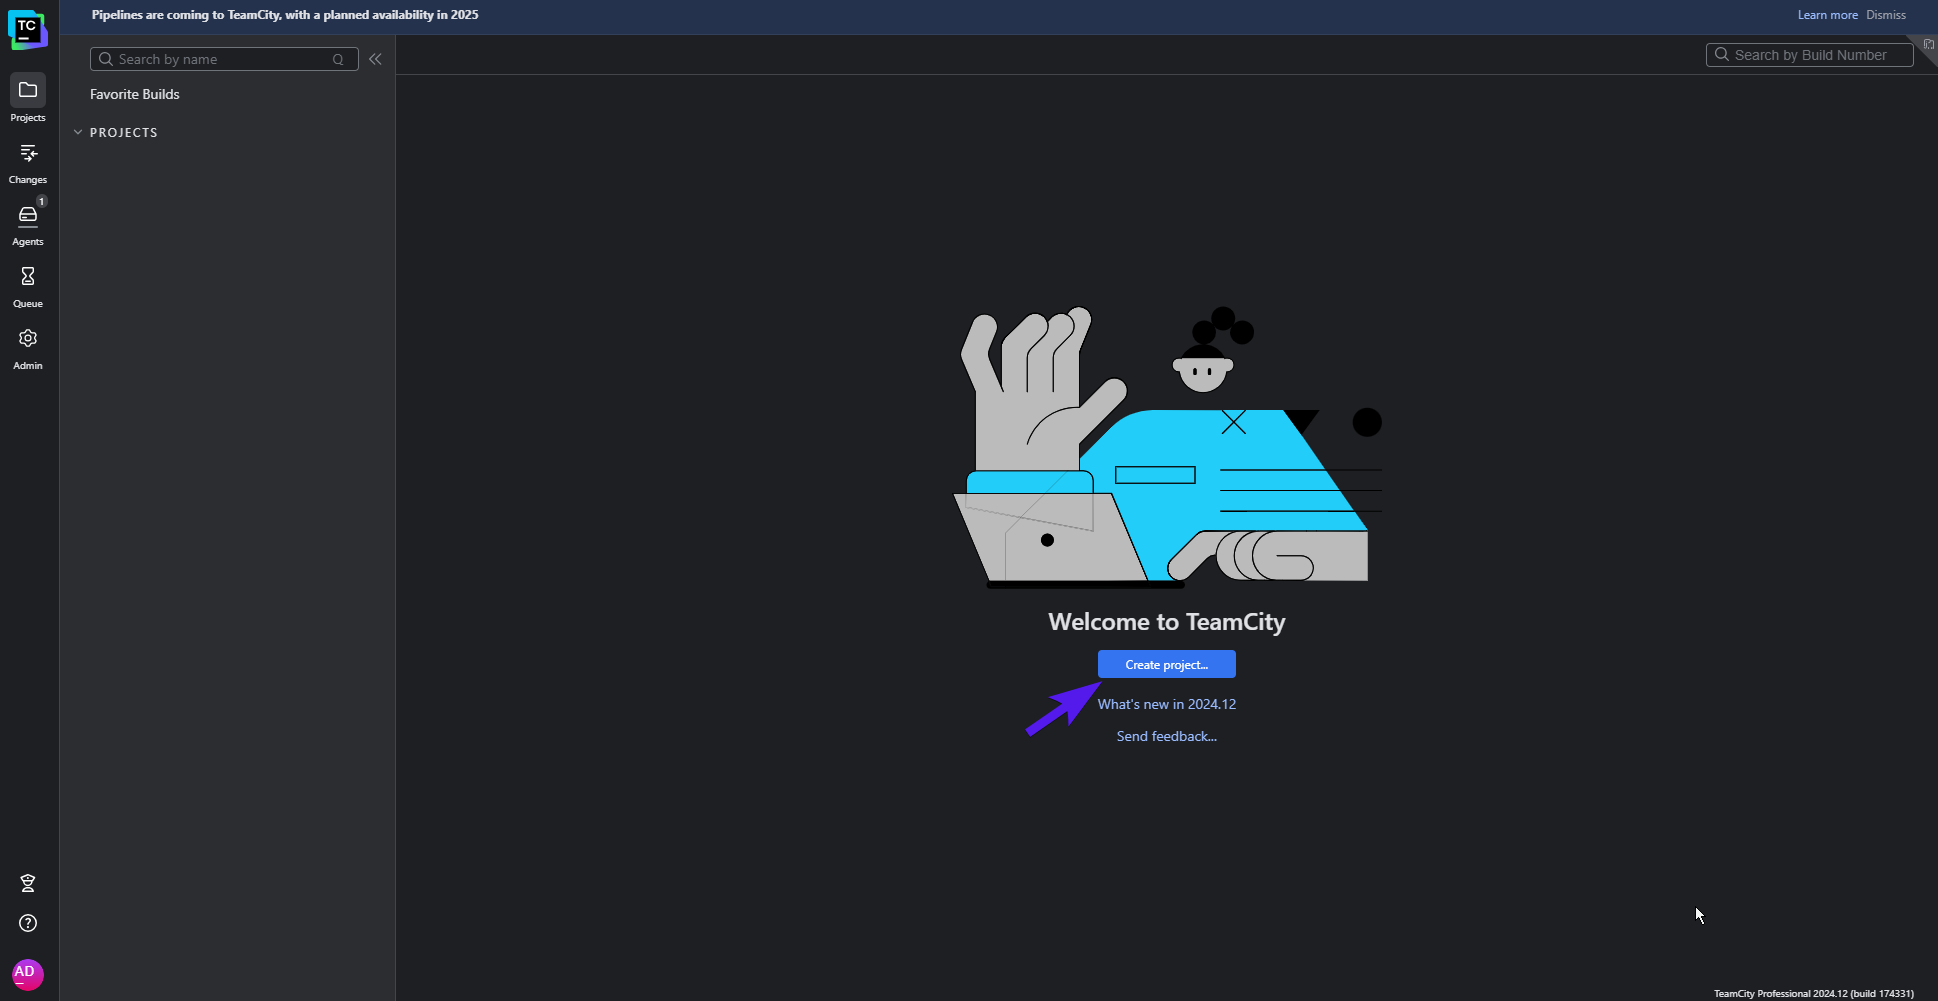
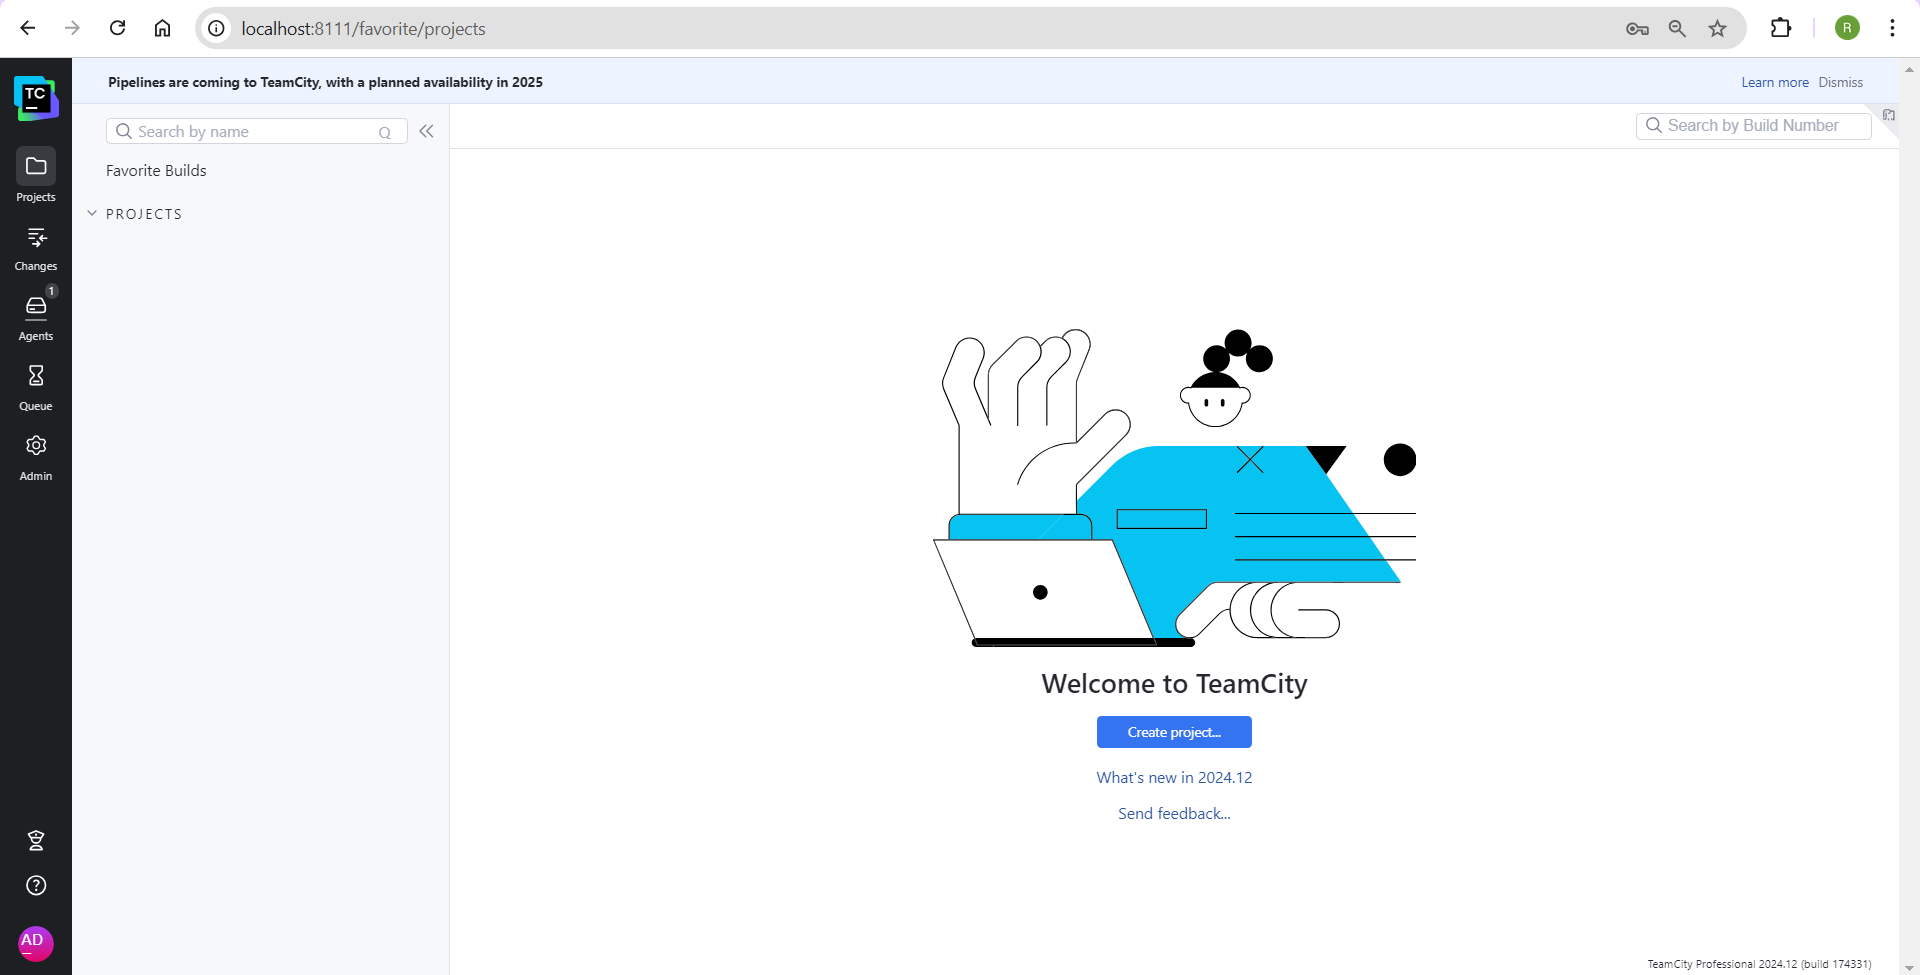
Once you have access to a TeamCity Cloud instance, here’s what your initial view will look like:
TeamCity Cloud dashboard
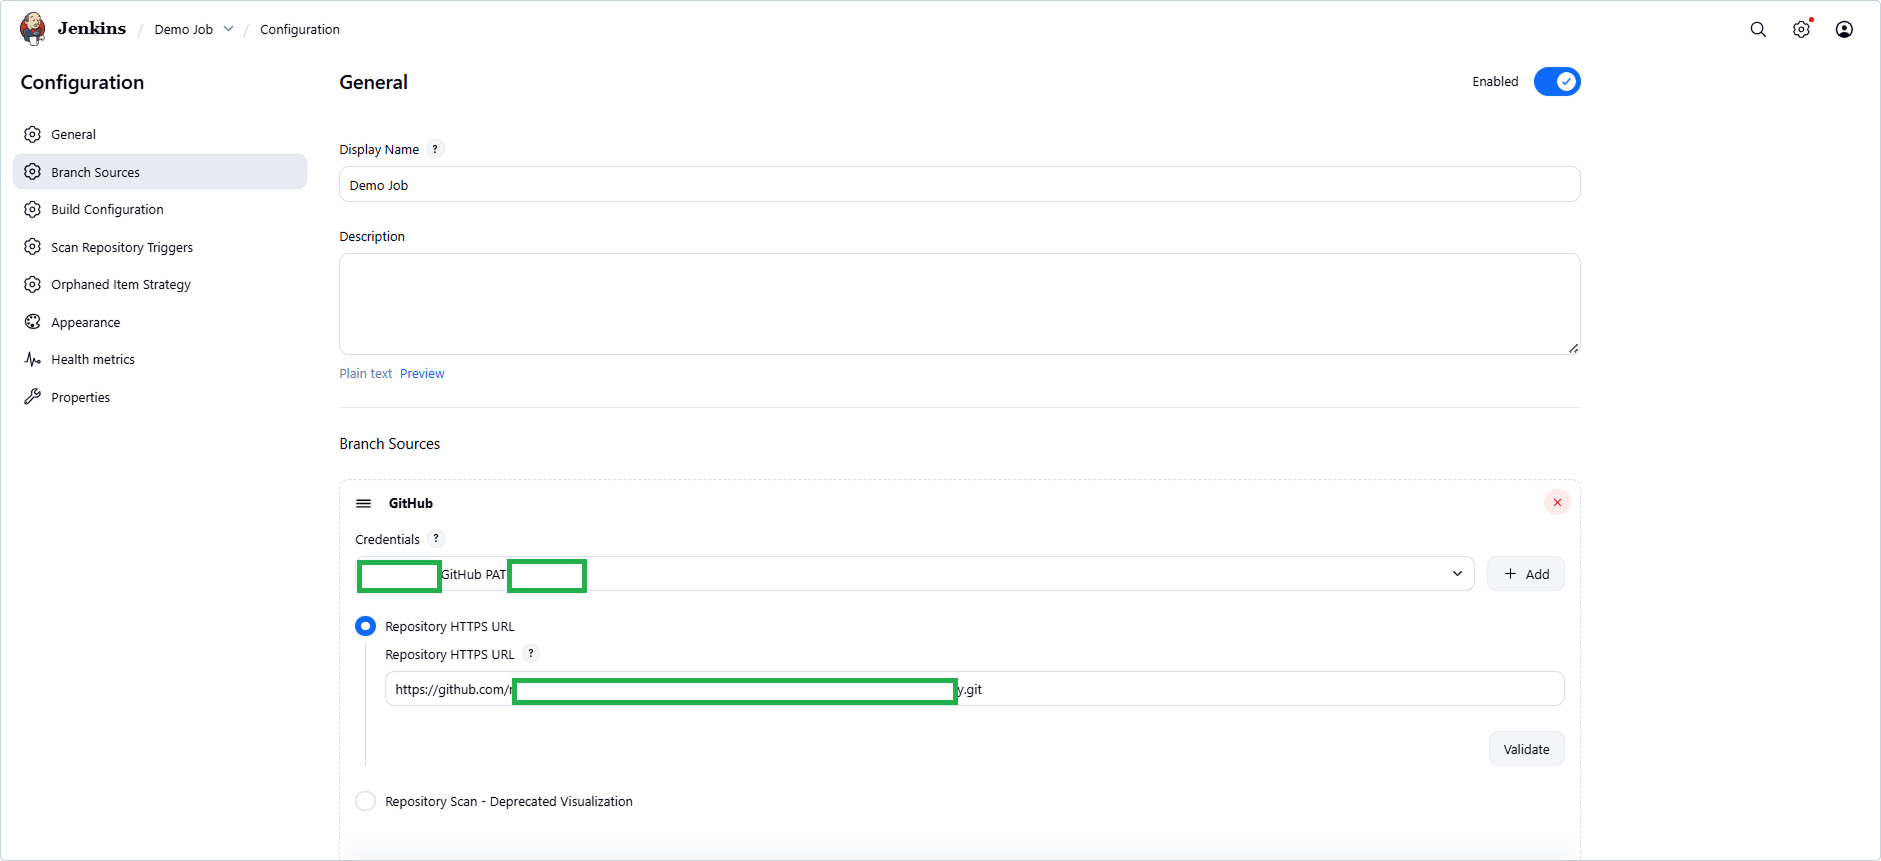
To get started with an Android project, click Create project… in the middle of the page. Then, you’ll be asked to provide a link to the source code of your project. If you signed up using a Git hosting provider (such as GitHub or Bitbucket Cloud), feel free to check out its corresponding section and use its dedicated project creation process.
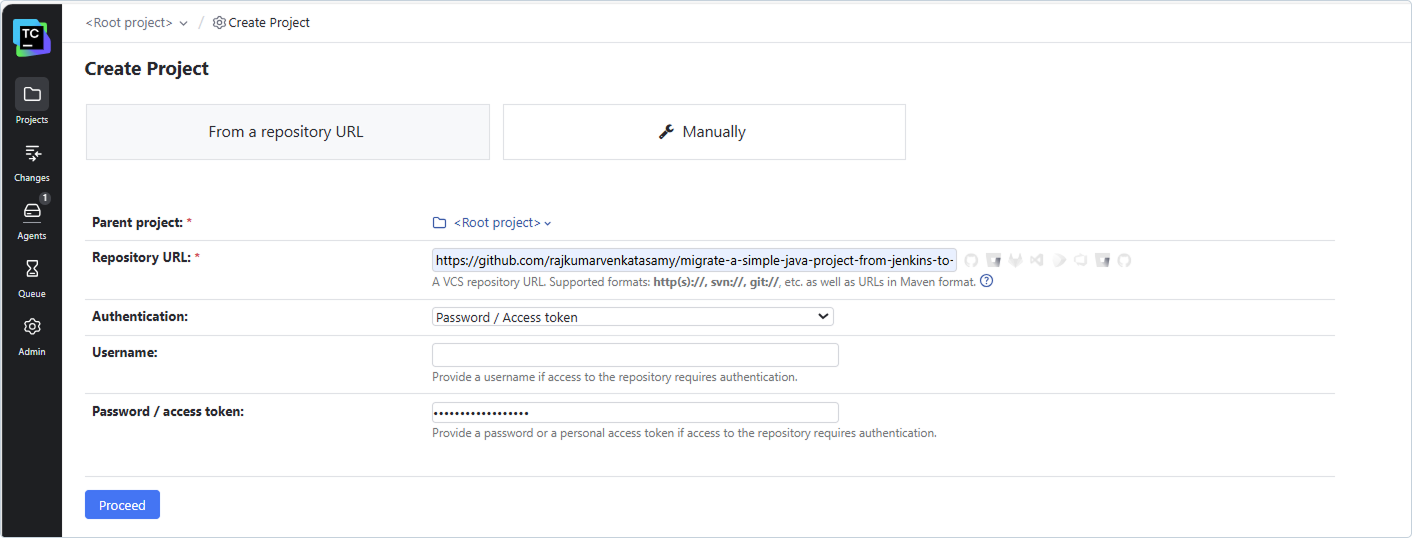
However, if you have the repository URL, you can directly use it in the From a repository URL tab. TeamCity will automatically detect the Git hosting provider and pull in your project from there.
Create Project page
If you don’t have an Android project at hand, you can use the following repository to follow the tutorial:
If the repository you’re trying to access is private or secured using a username and password combination, you can provide it here so that TeamCity can access it. Once you’ve entered the repository URL (and any additional details as needed), click Proceed.
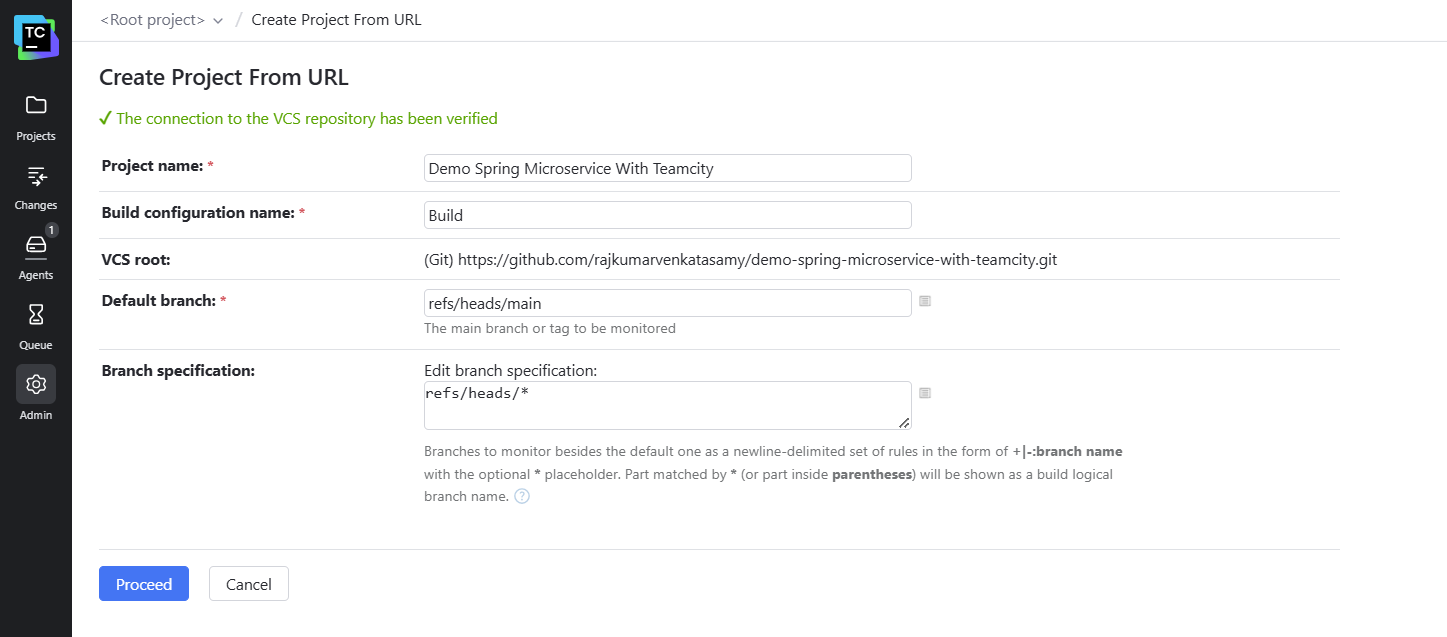
On the next page, TeamCity Cloud will verify the connection to the VCS repository. Once it’s successful, TeamCity will pull in some metadata related to the project, such as its name, its default branch, etc. You can modify these values before they are stored in the TeamCity project.
Connection verified when creating project
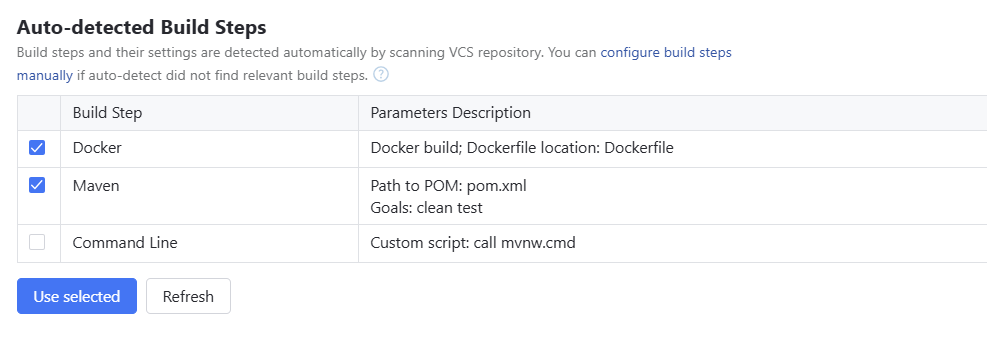
Once you’re happy with the information on this page, click the Proceed button. TeamCity will then begin to automatically detect any build steps applicable to the repository based on the available configuration files in the repository. Since this repository has Gradle-based configuration files, it will automatically suggest a set of Gradle tasks you can use to build the app from the repository (in this case, clean and build).
Check the box next to the Gradle build step, and click Use selected:
Selecting auto-suggested build steps
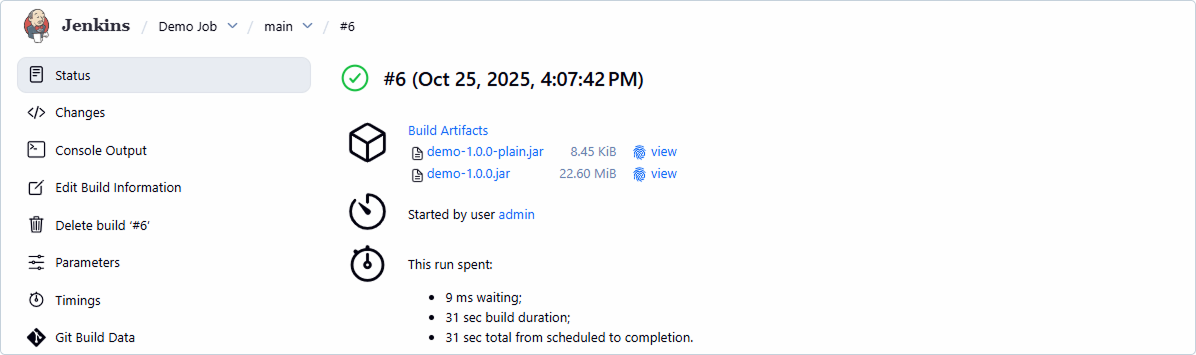
Once done, you’ll receive a small banner saying you can now run the first build in the project. Click Run at the top right to start the first build:
Starting your first build
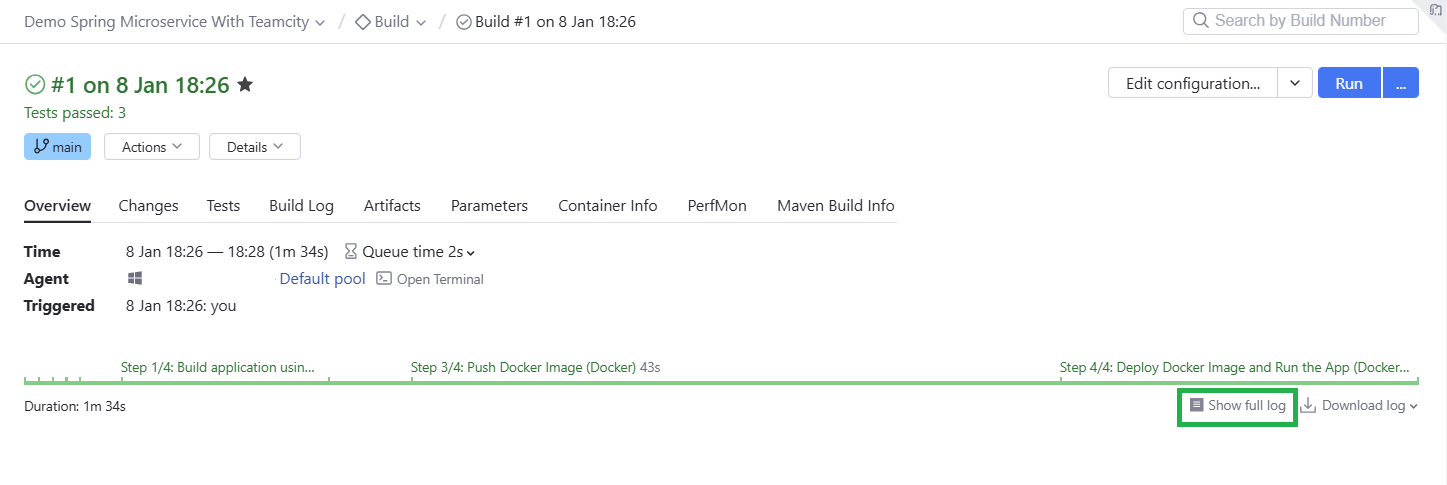
Once you click the button, a build will be queued, which will then wait for a build agent to become available. You can click Projects in the top navigation pane and choose the running build to view its properties and status:
Running build details
The build will be completed in about 5–6 minutes. Congratulations! You’ve set up your first Android CI/CD pipeline with TeamCity. Also, since you used a VCS repository URL to set up this pipeline, it’s been configured to automatically poll the repository URL at fixed intervals to see if any new changes have been pushed to the repo. If new changes are found, the pipeline will automatically pull the latest commit and run the build again.
You can further enhance this by setting up platform-specific webhooks. For instance, the repository you just set up is hosted on GitHub. TeamCity allows you to conveniently install a GitHub webhook so that GitHub automatically sends out a notification to TeamCity every time there is some activity on the repo:
Installing GitHub webhook
You can go ahead and do that if you’d like to. However, it’s not necessary for the purposes of this tutorial.
Configuring build artifacts
The repository you have set up includes two flavors (Free and Paid). For both of these flavors, there are two build variants (debug and release). This means that the result of a build task will include four binary files, one for each of the possible combinations of flavors and variants. Let’s configure the pipeline to extract and make these artifacts available for access after the pipeline has finished running.
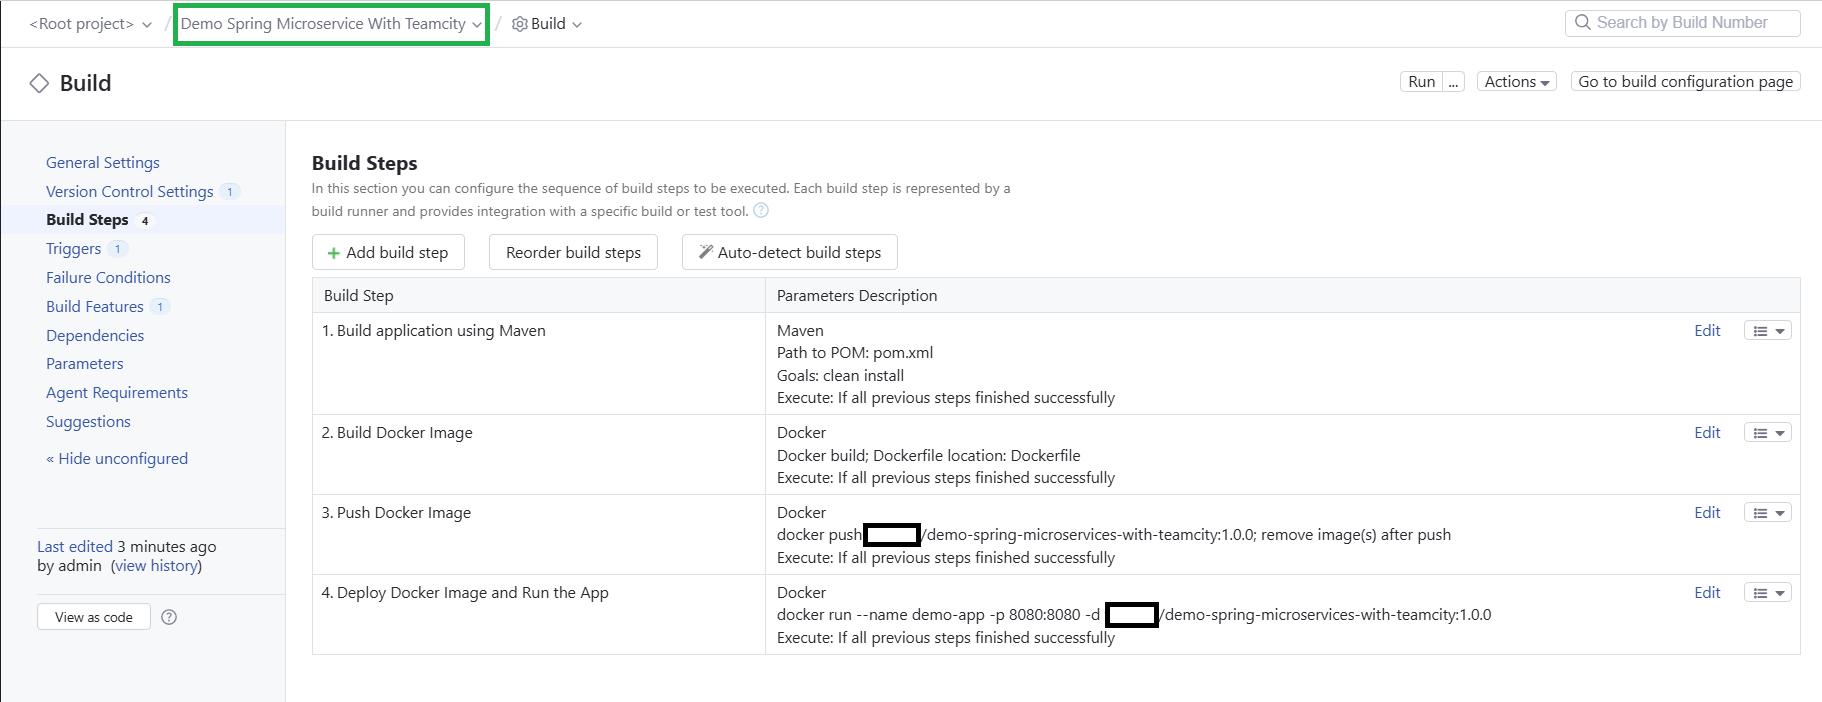
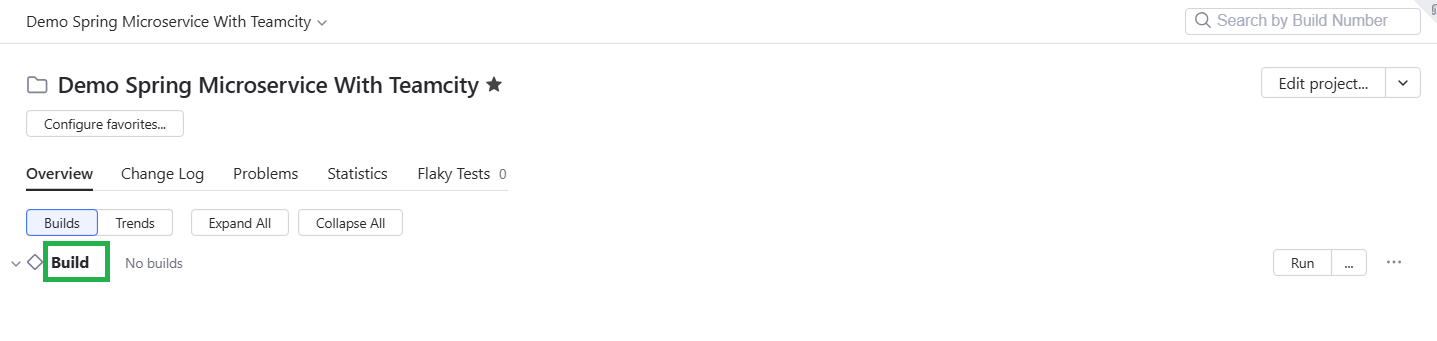
To do that, click Projects in the top navigation pane and click Build under Android App Teamcity to open the details page for the build configuration titled Build:
Navigating to build configuration page
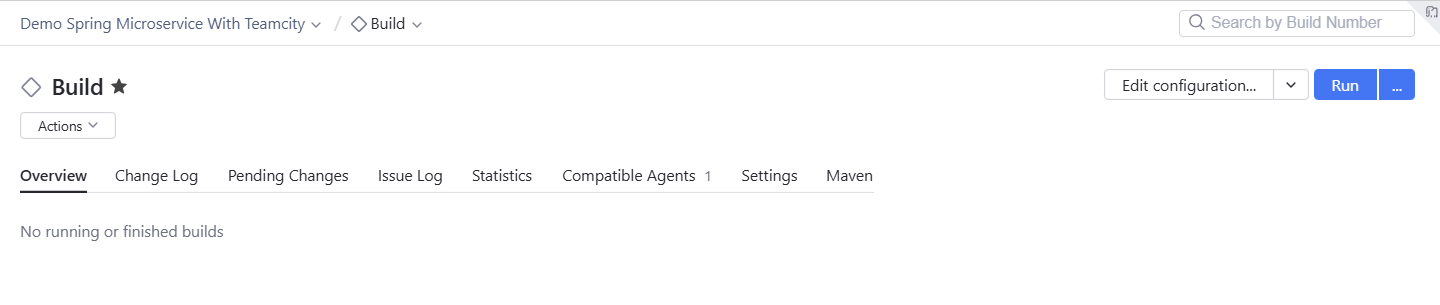
Here, click the Edit configuration button in the top right-hand corner of the screen:
Editing your build configuration
This is where you can configure the general settings for your build configuration. You’ll notice there’s a field titled Artifact paths towards the bottom of the list. This is where you need to define the paths of the artifacts that you wish to extract and retain after the build finishes running:
Setting artifact paths
When you run the Gradle build task, the artifacts generated by Gradle are stored in app/build/outputs/apk. Therefore, you need to enter the following under Artifact paths:
app/build/outputs/apk/*/*/* => output
You add /*/*/* after app/build/outputs/apk because the complete path of an APK binary generated after a build looks like this: app/build/outputs/apk/<flavor>/<variant>/app-<flavor>-<variant>-unsigned.apk.
To accommodate all possible values of <variant>, <flavor>, and binary file names, we’ve used the wildcard *.
=> is a feature of Ant-style paths and is used to separate output and input directories. output is the name of the folder in which the final binaries will be stored.
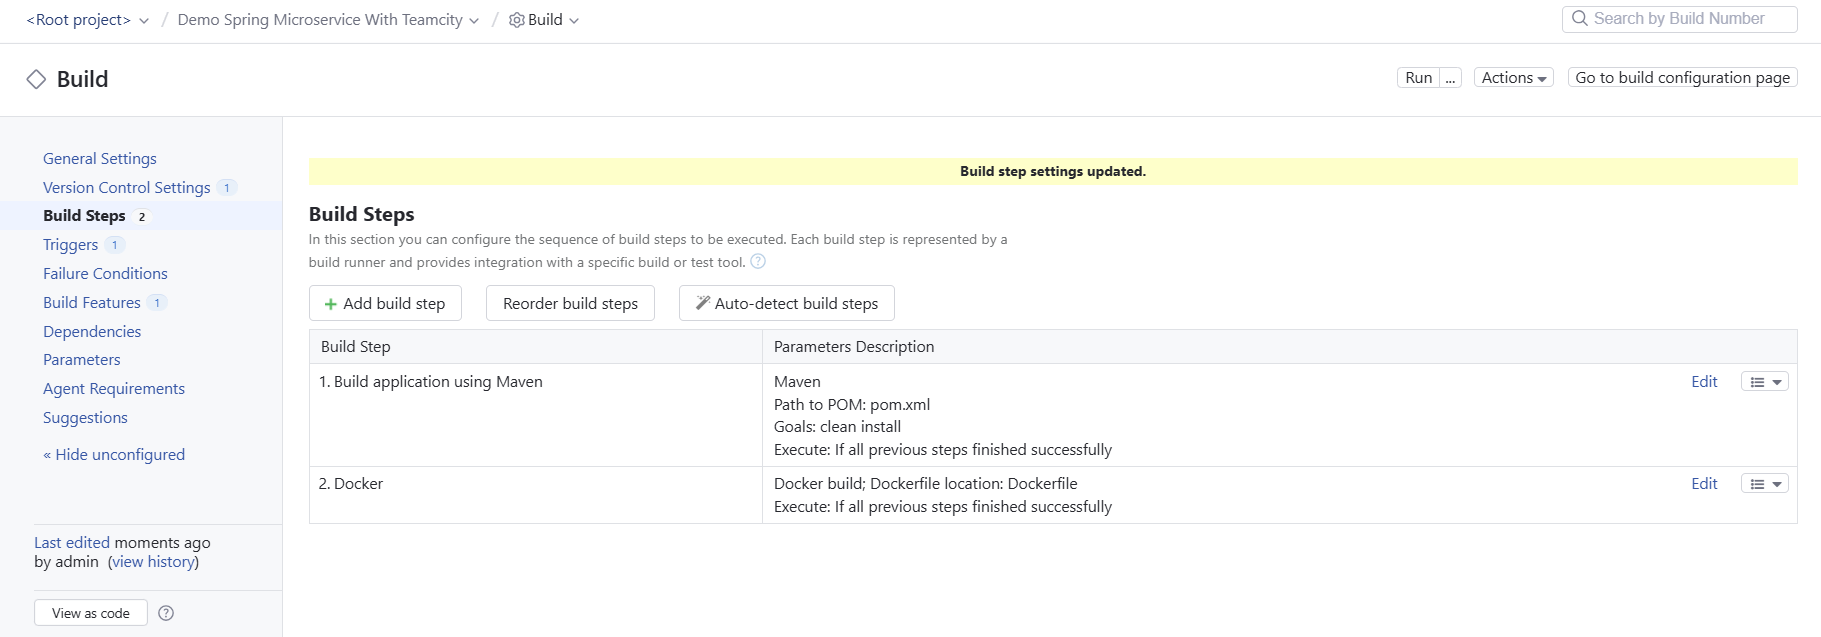
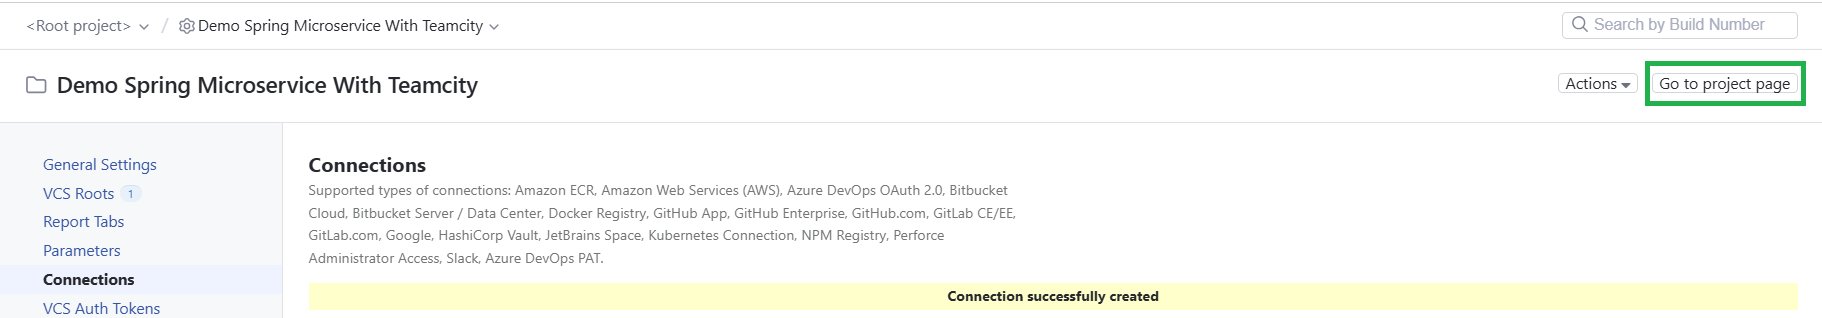
Once you’ve added this, click the Save button at the bottom of the page. You’ll see a yellow banner saying your changes have been saved:
Saving changes made to build configuration
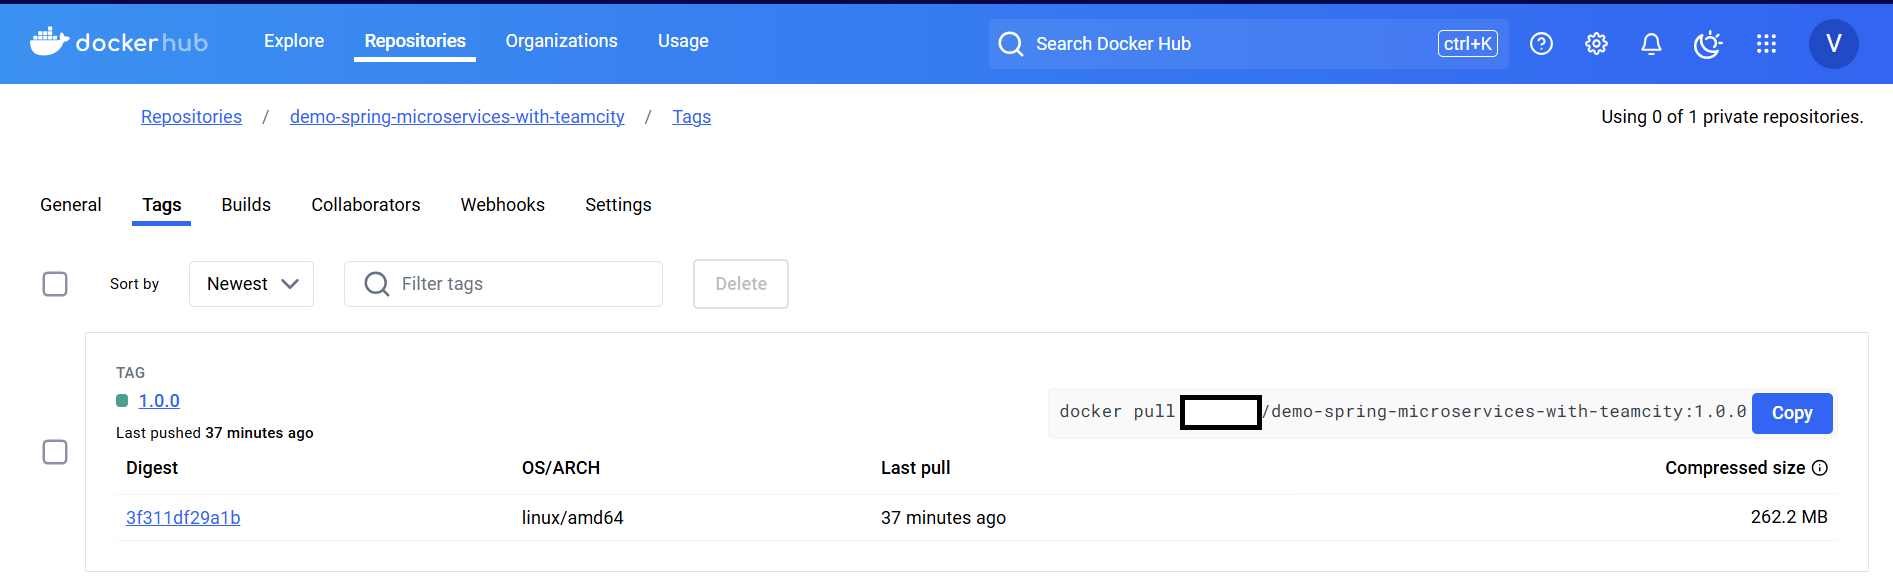
You can now try running the pipeline again using the Run button at the top right of the page to view the generated artifacts after the build is completed:
Viewing the generated artifacts
You’ve now set up a pipeline that’s triggered every time a commit is pushed to the main branch of your repo. This pipeline generates unsigned build artifacts for all flavor-variant combinations in your project, runs unit tests, and makes the build artifacts available for viewing.
Next, you’ll learn how to customize tests.
Customizing tests
As mentioned before, the Gradle task build also takes care of running unit tests on all generated build artifacts. However, there can be situations where you only want to run tests on a few variants of your app. In that case, you need to replace the clean build tasks with the appropriate tasks for your use case.
For instance, if you want to create an unsigned APK for the release variant of the free flavor of the app and run unit tests on it, you would replace clean build with assembleFreeRelease testFreeReleaseUnitTest. To do that, click on Projects in the top navigation pane and then click Build under Android App Teamcity. On the next page, click the Edit configuration button at the top right, just like you did in the previous step.
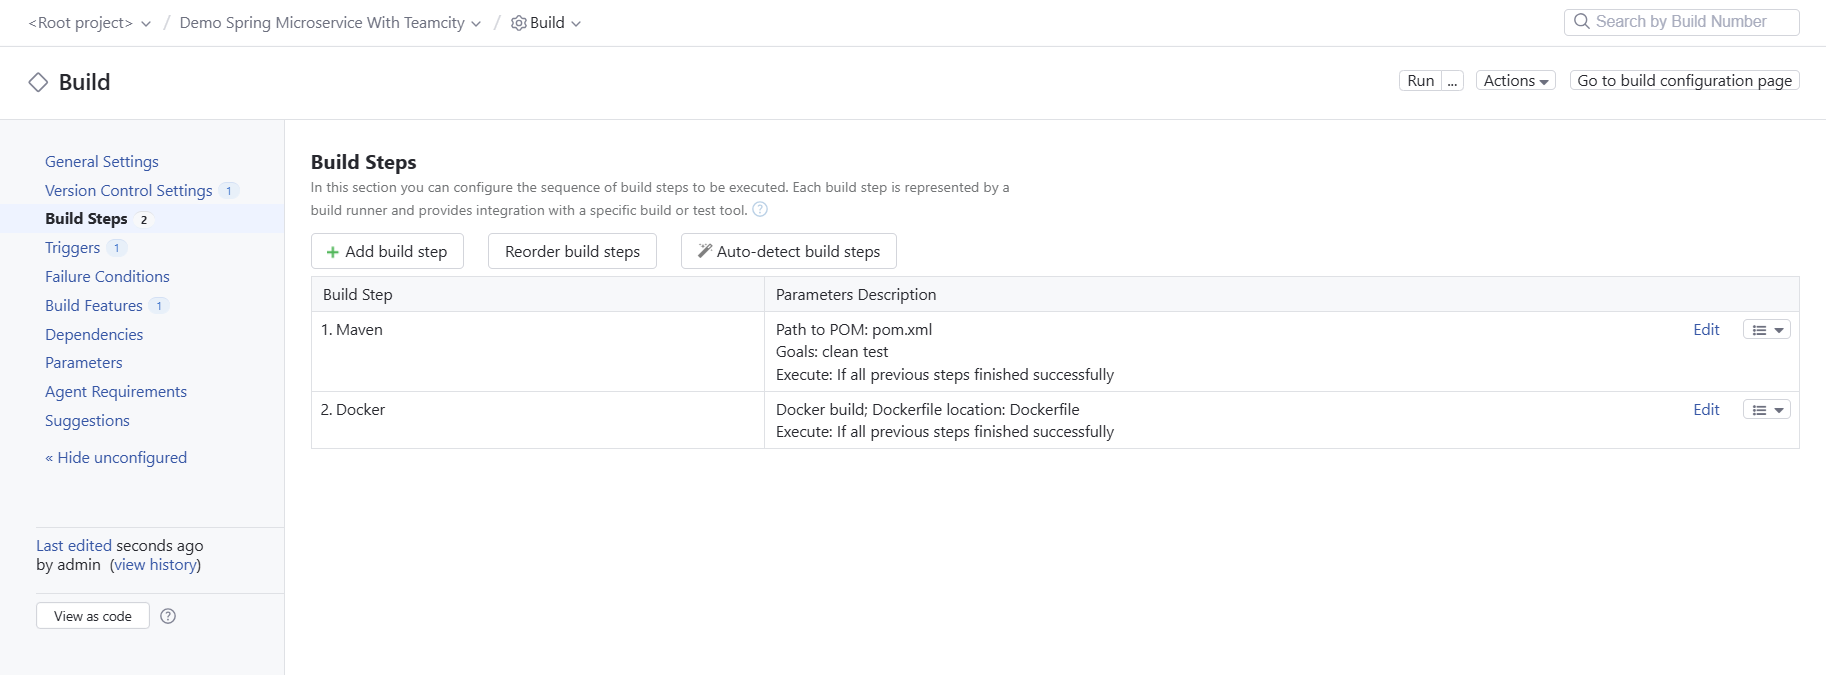
You should be on the General Settings page for the build configuration, which you accessed earlier to configure the artifacts path. On the left navigation pane, click Build Step: Gradle.
Navigating to build settings
This will open the Build Steps page, where you can modify the build steps for this build configuration. Click Edit on the right side of the first build step (titled Gradle):
Editing Gradle build step
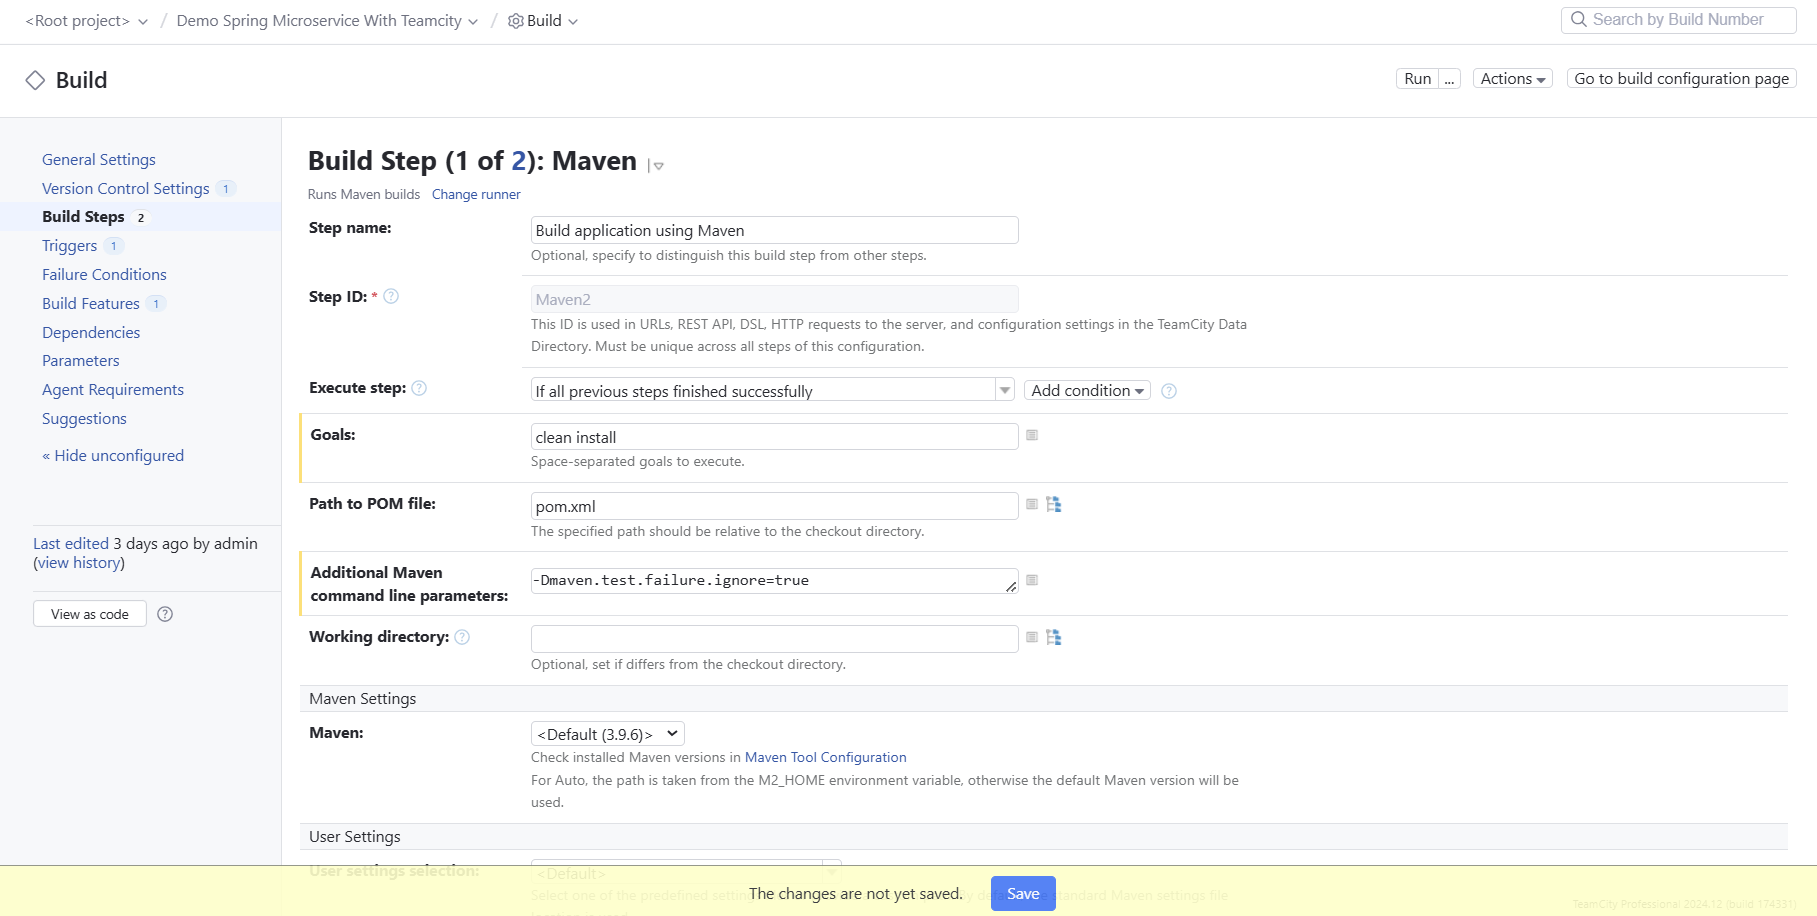
You can now update the Gradle tasks field to change the tasks that will be executed as part of this build. Replace clean build with assembleFreeRelease testFreeReleaseUnitTest:
Updating Gradle tasks
Now, click Save at the bottom. Once the changes are saved, click the Run button at the top right. This will trigger another run of this build configuration.
Once the build finishes running, you can take a look at the reports generated by TeamCity in the Tests tab on the build run details page:
Viewing test results
For each of the unit tests, you can view how long it took to run and if there was any stack trace left after the test was completed. You can also click the three dots on the far right of the test and select Show test history to compare the performance of the current run of the test with its past runs:
Comparing test run history
You can assign the investigation of a test to a team member and track its investigation history through TeamCity itself. If you’d like, you can also download the test results by clicking the Download link on the test overview page.
The number of tests in this repo is quite small, so the build run was completed in a few minutes. However, in a real-world project, there are usually hundreds, if not thousands, of unit tests. In such a situation, running all of these tests on the same runner agent one after another would take a significant amount of time. To solve this, you can use TeamCity’s parallel tests build feature.
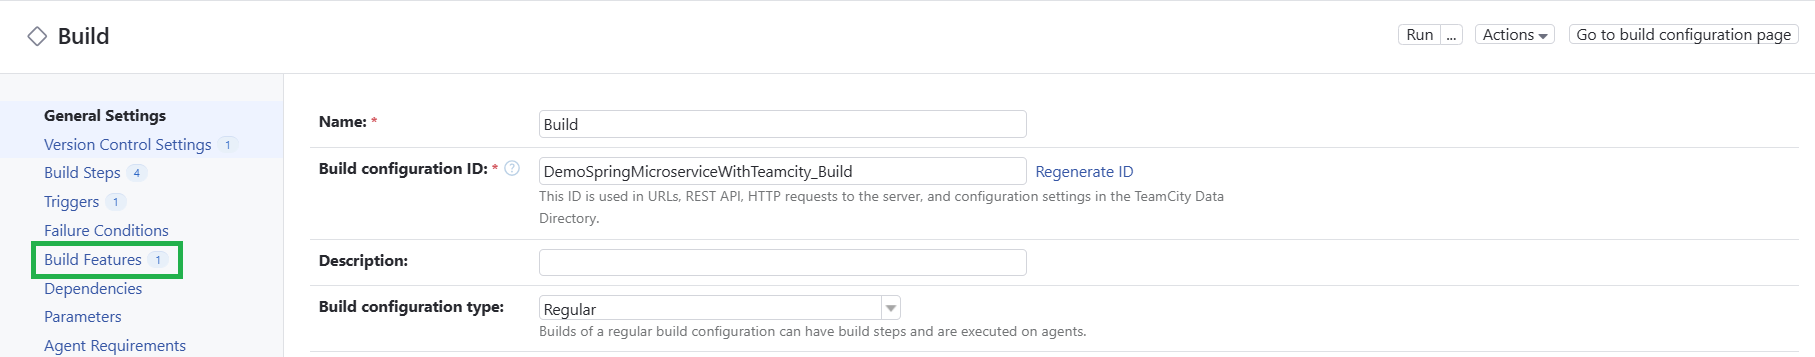
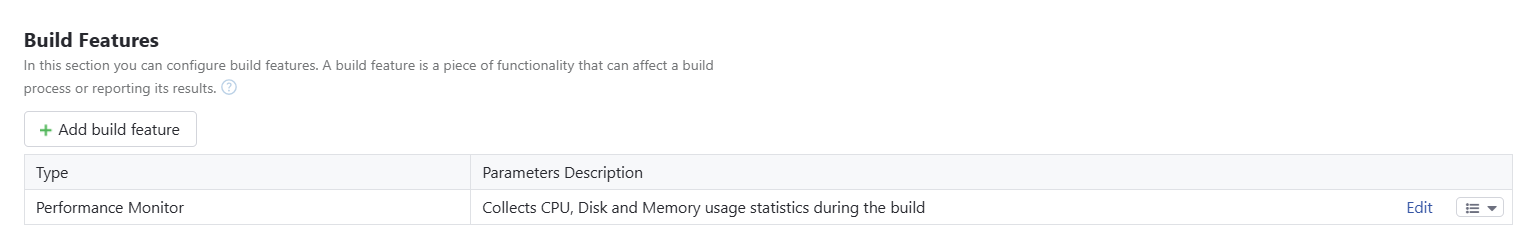
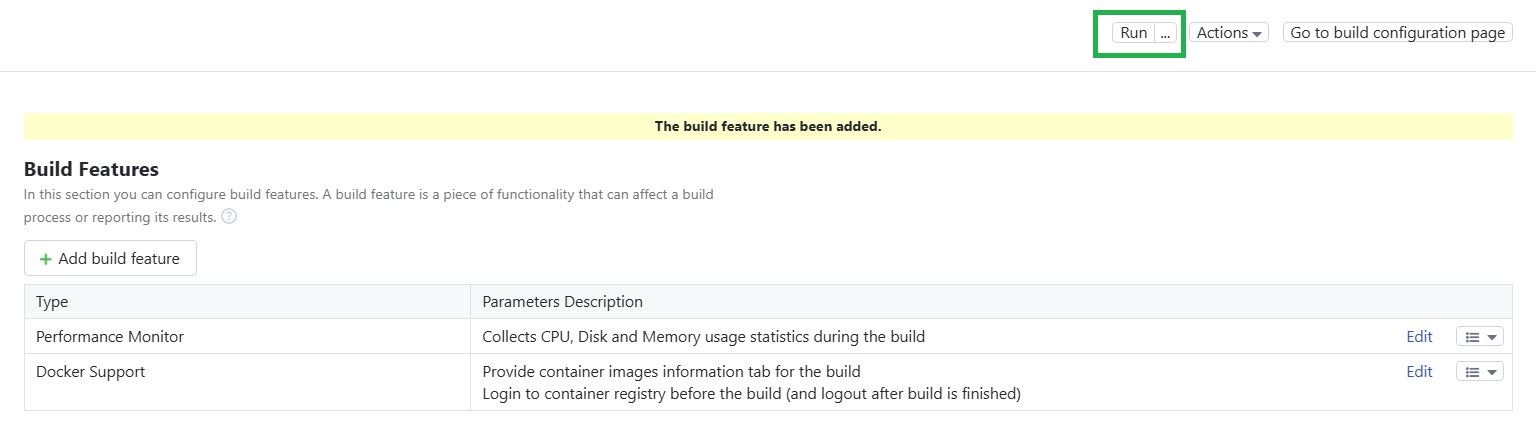
TeamCity is capable of parallelizing your test runs by splitting them over multiple build agents, helping you to minimize the overall time it takes to run all the tests. To set this up, click the Edit configuration button on the build run details page and click Build Features on the left navigation pane:
Navigating to the Build Features page
On the Build Features page, click the + Add build feature button. In the dialog box that opens, choose Parallel tests in the dropdown menu:
Searching for parallel tests
You need to enter the maximum number of batches for executing tests in parallel. Enter a value between 4 and 8 to get the maximum benefit from parallelization.
Setting up parallel build batches
Once done, click the Save button. You can now try running tests for a repository that has a larger number of test cases to see the difference in performance for yourself!
Managing multiple builds
Since this app has multiple flavors and variants, it would make sense to make use of the matrix builds offered by TeamCity to speed up build pipelines by splitting each variant-flavor combination into its own run instance. Additionally, this also allows you to build specific combinations of the application without having to necessarily build all or just one variant-flavor combination.
To do this, you need to create a new build configuration. Click Projects in the top navigation pane and click Android App Teamcity. On the project details page, click the Edit project… button in the top right-hand corner:
Navigating to project configuration
On the General Settings page, click the + Create build configuration button under the Build Configurations section:
Creating a new build configuration
This will take you to the Create Build Configuration wizard. Enter the same repository URL as before (https://github.com/krharsh17/android-app-teamcity) in the Repository URL field and click Proceed:
Entering repository URL
Set the Build configuration name on the next page to Matrix Builds, and leave the default values in all other fields. Then, click the Proceed button:
Setting build configuration details
TeamCity will notify you that a similar VCS root has been found. Click the Use this button in this dialog box:
Choosing an existing VCS root
This will ensure that TeamCity polls the VCS URL only once for both of these build configurations to avoid additional performance overhead.
Once the build configuration is complete, you should get a notification confirming it has been created:
New build configuration created
This time, you don’t need to set up the clean build Gradle tasks, so don’t check any boxes on this page. Instead, click the link above the table that says configure build steps manually.
You’ll be taken to the New Build Step page, where you can choose your preferred runner for the build step:
Selecting a build runner
Choose Gradle from this list. On the next page that opens, enter clean test%env.FLAVOR%%env.VARIANT% in the Gradle tasks field:
Entering a Gradle task
This will ensure that the runner first cleans the build folders and then runs the test task for the flavor and variant provided by the environment variables. For example, for the release variant of the free app, the task would be called clean testFreeRelease.
Scroll down and click the Save button. You’ll then be taken back to the Build Steps page:
New build step added
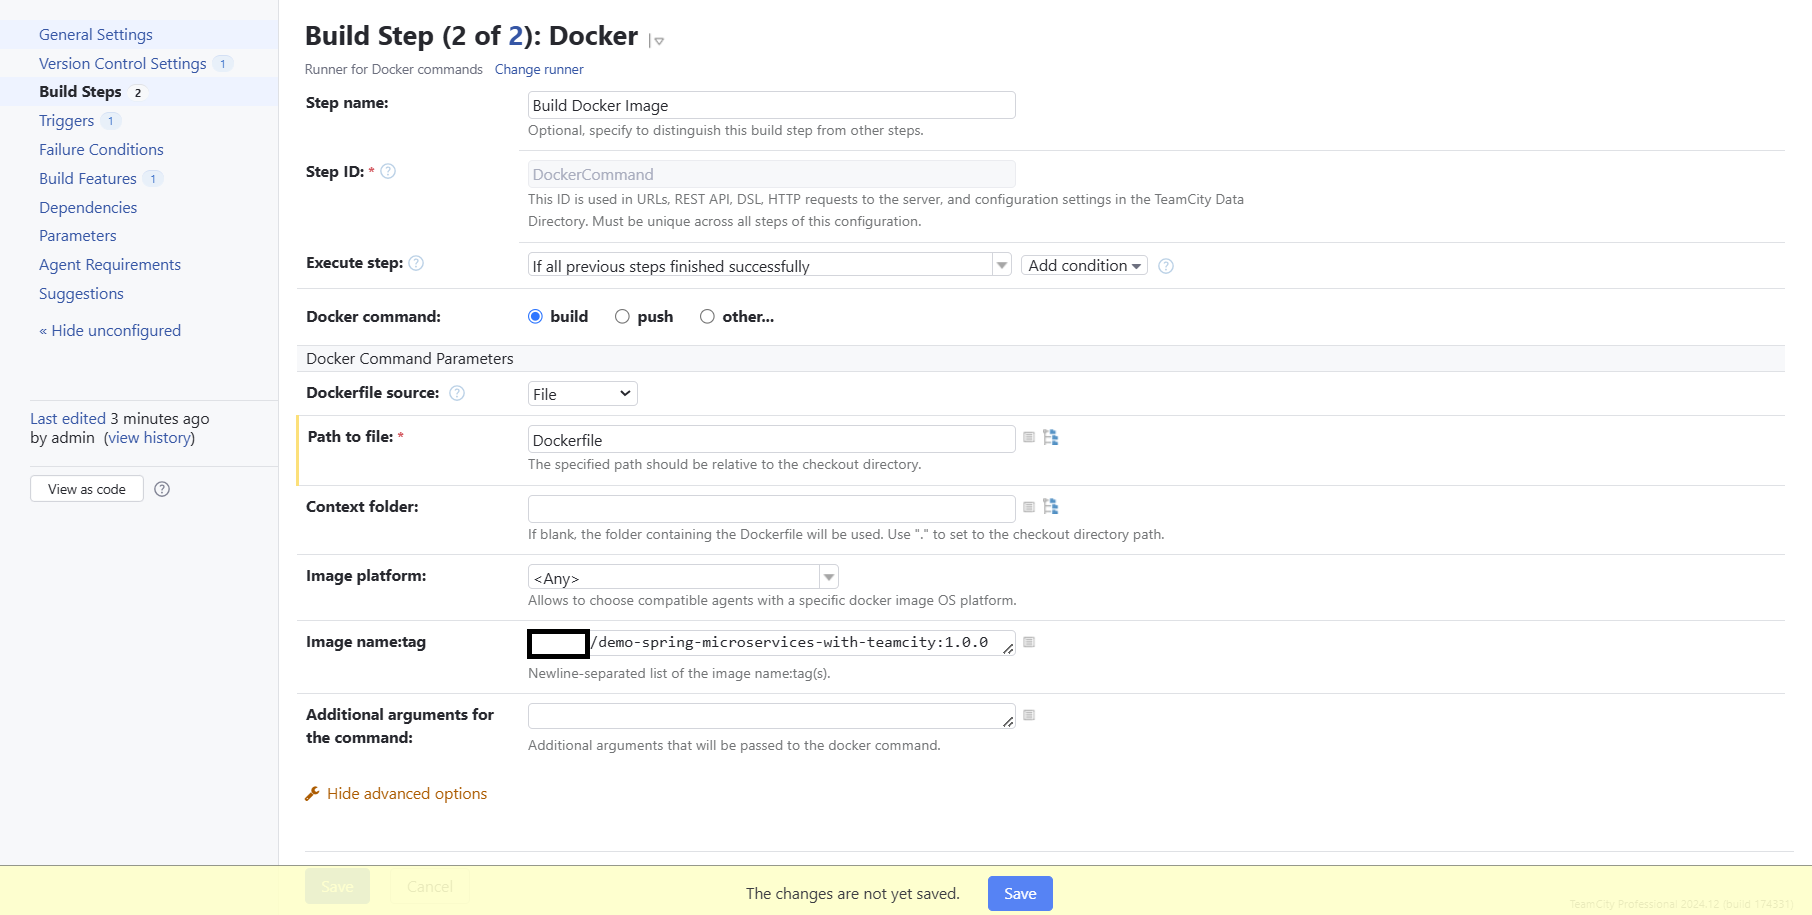
Click the + Add build step button and add another Gradle build step with the task assemble%env.FLAVOR%%env.VARIANT%. This step will generate build artifacts for the given flavor and variant of the app.
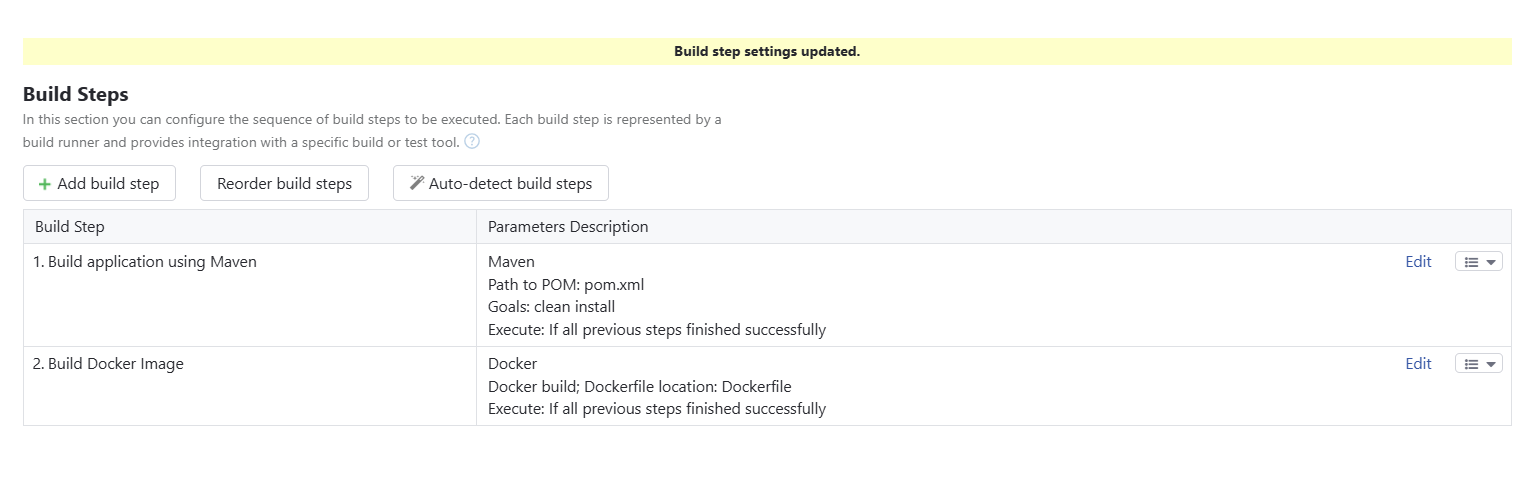
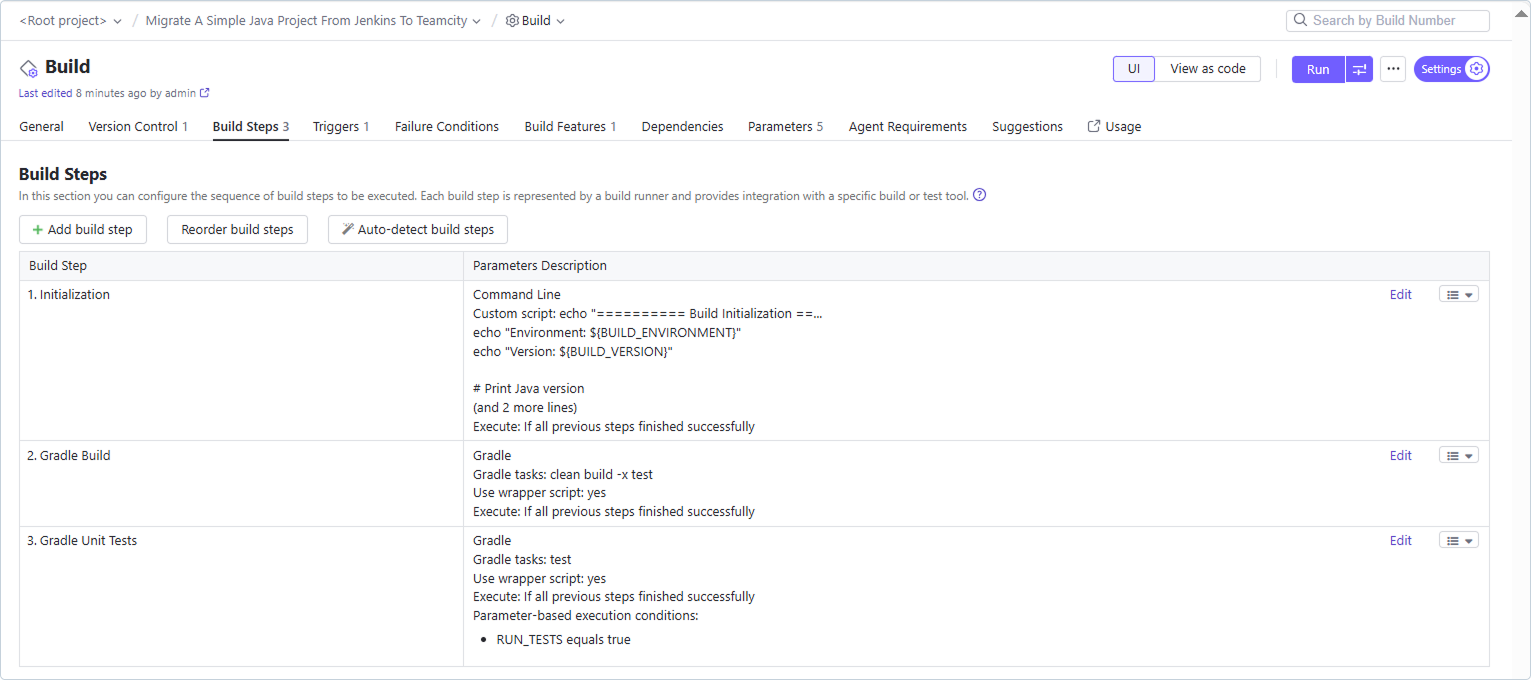
Once done, your Build Steps page should list the two Gradle-based build steps you created with a quick summary of the Gradle tasks that will be run as part of them:
Build steps updated
Now, you need to do two more things: define the values for the two environment variables you used and configure artifact paths.
You already know how to set the artifact paths for a build configuration. For this build configuration, set the value of the Artifact paths field to app/build/outputs/apk/*/*/* => output, the same as for the previous one.
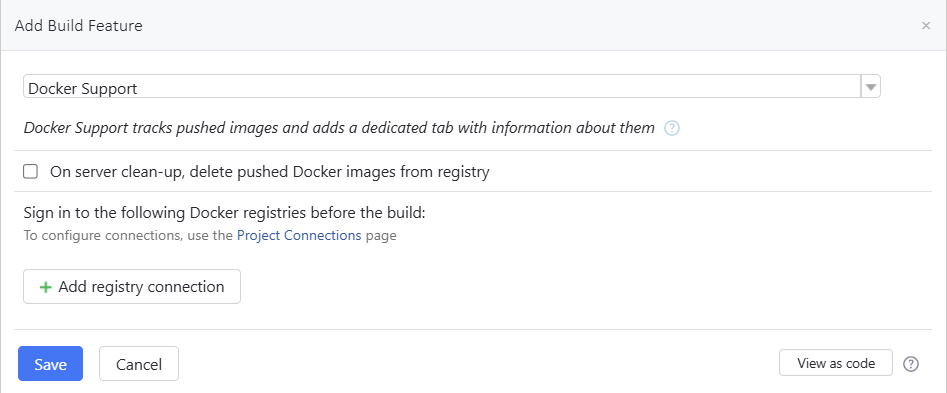
To set the matrix values for the flavor and variant fields, click Build Features on the left navigation pane. On the Build Features page, click the + Add build feature button and search for Matrix Build in the dropdown menu in the dialog box:
Searching for Matrix Build on the Build Features page
Once you select the Matrix Build option from the dropdown list, you’ll be asked to provide parameters for the matrix build along with their values. Provide a parameter’s name as env.FLAVOR and its value as Free. Add another parameter, env.VARIANT, with two values: Release and Debug.
Configuring matrix build
Now, click the Save button. This completes the setup of matrix builds on this pipeline. You can try testing it by clicking the Run button in the top right-hand corner of the page.
You’ll now be able to view the results of each run separately, along with separate build artifacts and test results.
Matrix build results
You can click the Dependencies tab to view the build run details for each of the individual runs:
Viewing individual build run details
As you’ve seen before, you can explore each of these entries as a standalone, complete build run.
Packaging and deployment
One key part of an Android CI/CD pipeline is pushing out the release binaries to Google Play so they can be published to users. You can use TeamCity and Gradle Play Publisher (GPP) to automate this as well.
There are a few prerequisites before you start this process:
1. Make sure you have manually uploaded the first APK/AAB for your Android project to Google Play Console.
3. You need to create a service account on Google Cloud Platform to be able to use the Google Play Developer APIs and retrieve its JSON credentials file. To do this, follow these steps before progressing to the next step.
Once you’ve completed the steps detailed in the link above, you need to install and configure GPP in your Android project. To do that, add the following line of code to the plugins block in the app-level build.gradle.kts file:
kt
id("com.github.triplet.play") version "3.9.1"
Then, at the root level of this file, add a new play {} block with the following content:
kt
play {
    serviceAccountCredentials.set(file("play_config.json"))
    track.set("internal")
    releaseStatus.set(ReleaseStatus.DRAFT)
    defaultToAppBundles.set(true)
}
This configures GPP to use the service account credentials from a file named play_config.json, set the track to internal and release status to DRAFT when pushing binaries to Play Console, and use app bundles in place of APKs by default.
This concludes the necessary configuration steps for your Android project. Commit and push these changes to the GitHub repository before proceeding.
You’ll now create a new build configuration for pushing binaries to Google Play in TeamCity. Follow the same steps as before to create a new build configuration. Set the first build step to use Gradle as the runner and bundleFreeRelease as the Gradle task to run:
Build steps
Add another step to this build configuration, but choose Command Line as the build runner this time:
Configuring a new command line build step
The new build step page for the command line runner will open. You need to provide the custom script that signs and publishes the app bundle to Google Play. Enter the following code in the Custom script field:
# Create the keystore file from the environment variables
echo %env.ANDROID_KEYSTORE_FILE% > keystore.jks.b64
base64 -d -i keystore.jks.b64 > app/keystore.jks

# Sign the AAB using the keystore and credentials retrieved from the environment variables
jarsigner \
-keystore app/keystore.jks \
-storepass %env.KEYSTORE_STORE_PASSWORD% \
-keypass %env.KEYSTORE_KEY_PASSWORD% \
-signedjar release.aab \
app/build/outputs/bundle/freeRelease/app-free-release.aab \
%env.KEYSTORE_KEY_ALIAS%

# Create the GCP service account credentials file from the environment variables
echo %env.PLAY_CONFIG_JSON% > play_config.json.b64
base64 -d -i play_config.json.b64 > app/play_config.json

# Use GPP to publish the app bundle
./gradlew publishFreeBundle --artifact-dir release.aab
The code has inline comments to explain what each line does. Once done, click the Save button at the bottom of the page:
Configuring your command line script
You also need to define the following environment variables to provide the script with the right credentials to sign and publish the app:
Click Parameters in the left navigation pane to go to a page where you can define these environment variables. You’ll see that TeamCity has already populated the list of required variables on this page for you:
Viewing newly recognized environment variables
For KEYSTORE_KEY_ALIAS, KEYSTORE_KEY_PASSWORD, and KEYSTORE_STORE_PASSWORD, feel free to click Edit and provide their values in the resultant dialog boxes:
Configuring environment variables
For ANDROID_KEYSTORE_FILE and PLAY_CONFIG_JSON, you first need to convert the files into Base64 using a tool like openssl, and then paste the Base64-encoded contents into the value fields of these variables.
This sets up the pipeline to build and publish a signed release of the free version of your application. You can try clicking the Run button at the top right of the page to trigger a run and see it in action.
Once the run succeeds, you’ll see a BUILD SUCCESSFUL message in the logs:
Successful build result logs
And here is the latest release of your app, available on the internal track in Google Play Console and ready for you to edit and promote:
Play Console internal testing page
You’ll notice that the new release has the same developer-facing name (“2.0”) as the previous one. This is because no name was specified in GPP’s configurations. You can take a look at the GPP documentation to learn how to do that yourself.
Best practices and tips
Now that you can set up your own pipeline for Android using TeamCity, here are a few key best practices you can consider implementing to ensure your pipelines are efficient and fast:
1. Version control and versioning practices: An effective CI/CD pipeline strongly depends on a robust version control system (VCS) like Git. Ensure your team adheres to clear versioning practices and implements a consistent branching strategy (e.g. feature branches). Develop customized pipelines for different branches to ensure you aren’t running unnecessary steps on WIP code, for instance.
2. Clear pass/fail criteria and thresholds: Clearly define what constitutes a successful build and test run. This can involve setting thresholds for unit test coverage, getting a green light on other code checks, and so on. You should configure TeamCity with pass/fail criteria for each stage of the pipeline to ensure robust builds and encourage developers to write better code.
3. Leveraging TeamCity notifications and alerts: TeamCity offers a detailed notification system to help notify users about pipeline events across web browsers, email, Slack, and IDEs. Make sure to set up alerts for build failures and critical test failures to keep your development team informed and allow for prompt issue resolution.
4. Collaboration and feedback loop: An effective CI/CD pipeline fosters collaboration within your development team. You should use build pipeline visualization within TeamCity to provide developers with a clear picture of the entire build and test process. You can also use test and build investigations to assign and collaborate on investigations into why a build or a test failed, right within TeamCity. Also, encourage team members to review build failures and code coverage reports to identify areas for improvement. This can help develop a culture of code quality and continuous improvement.
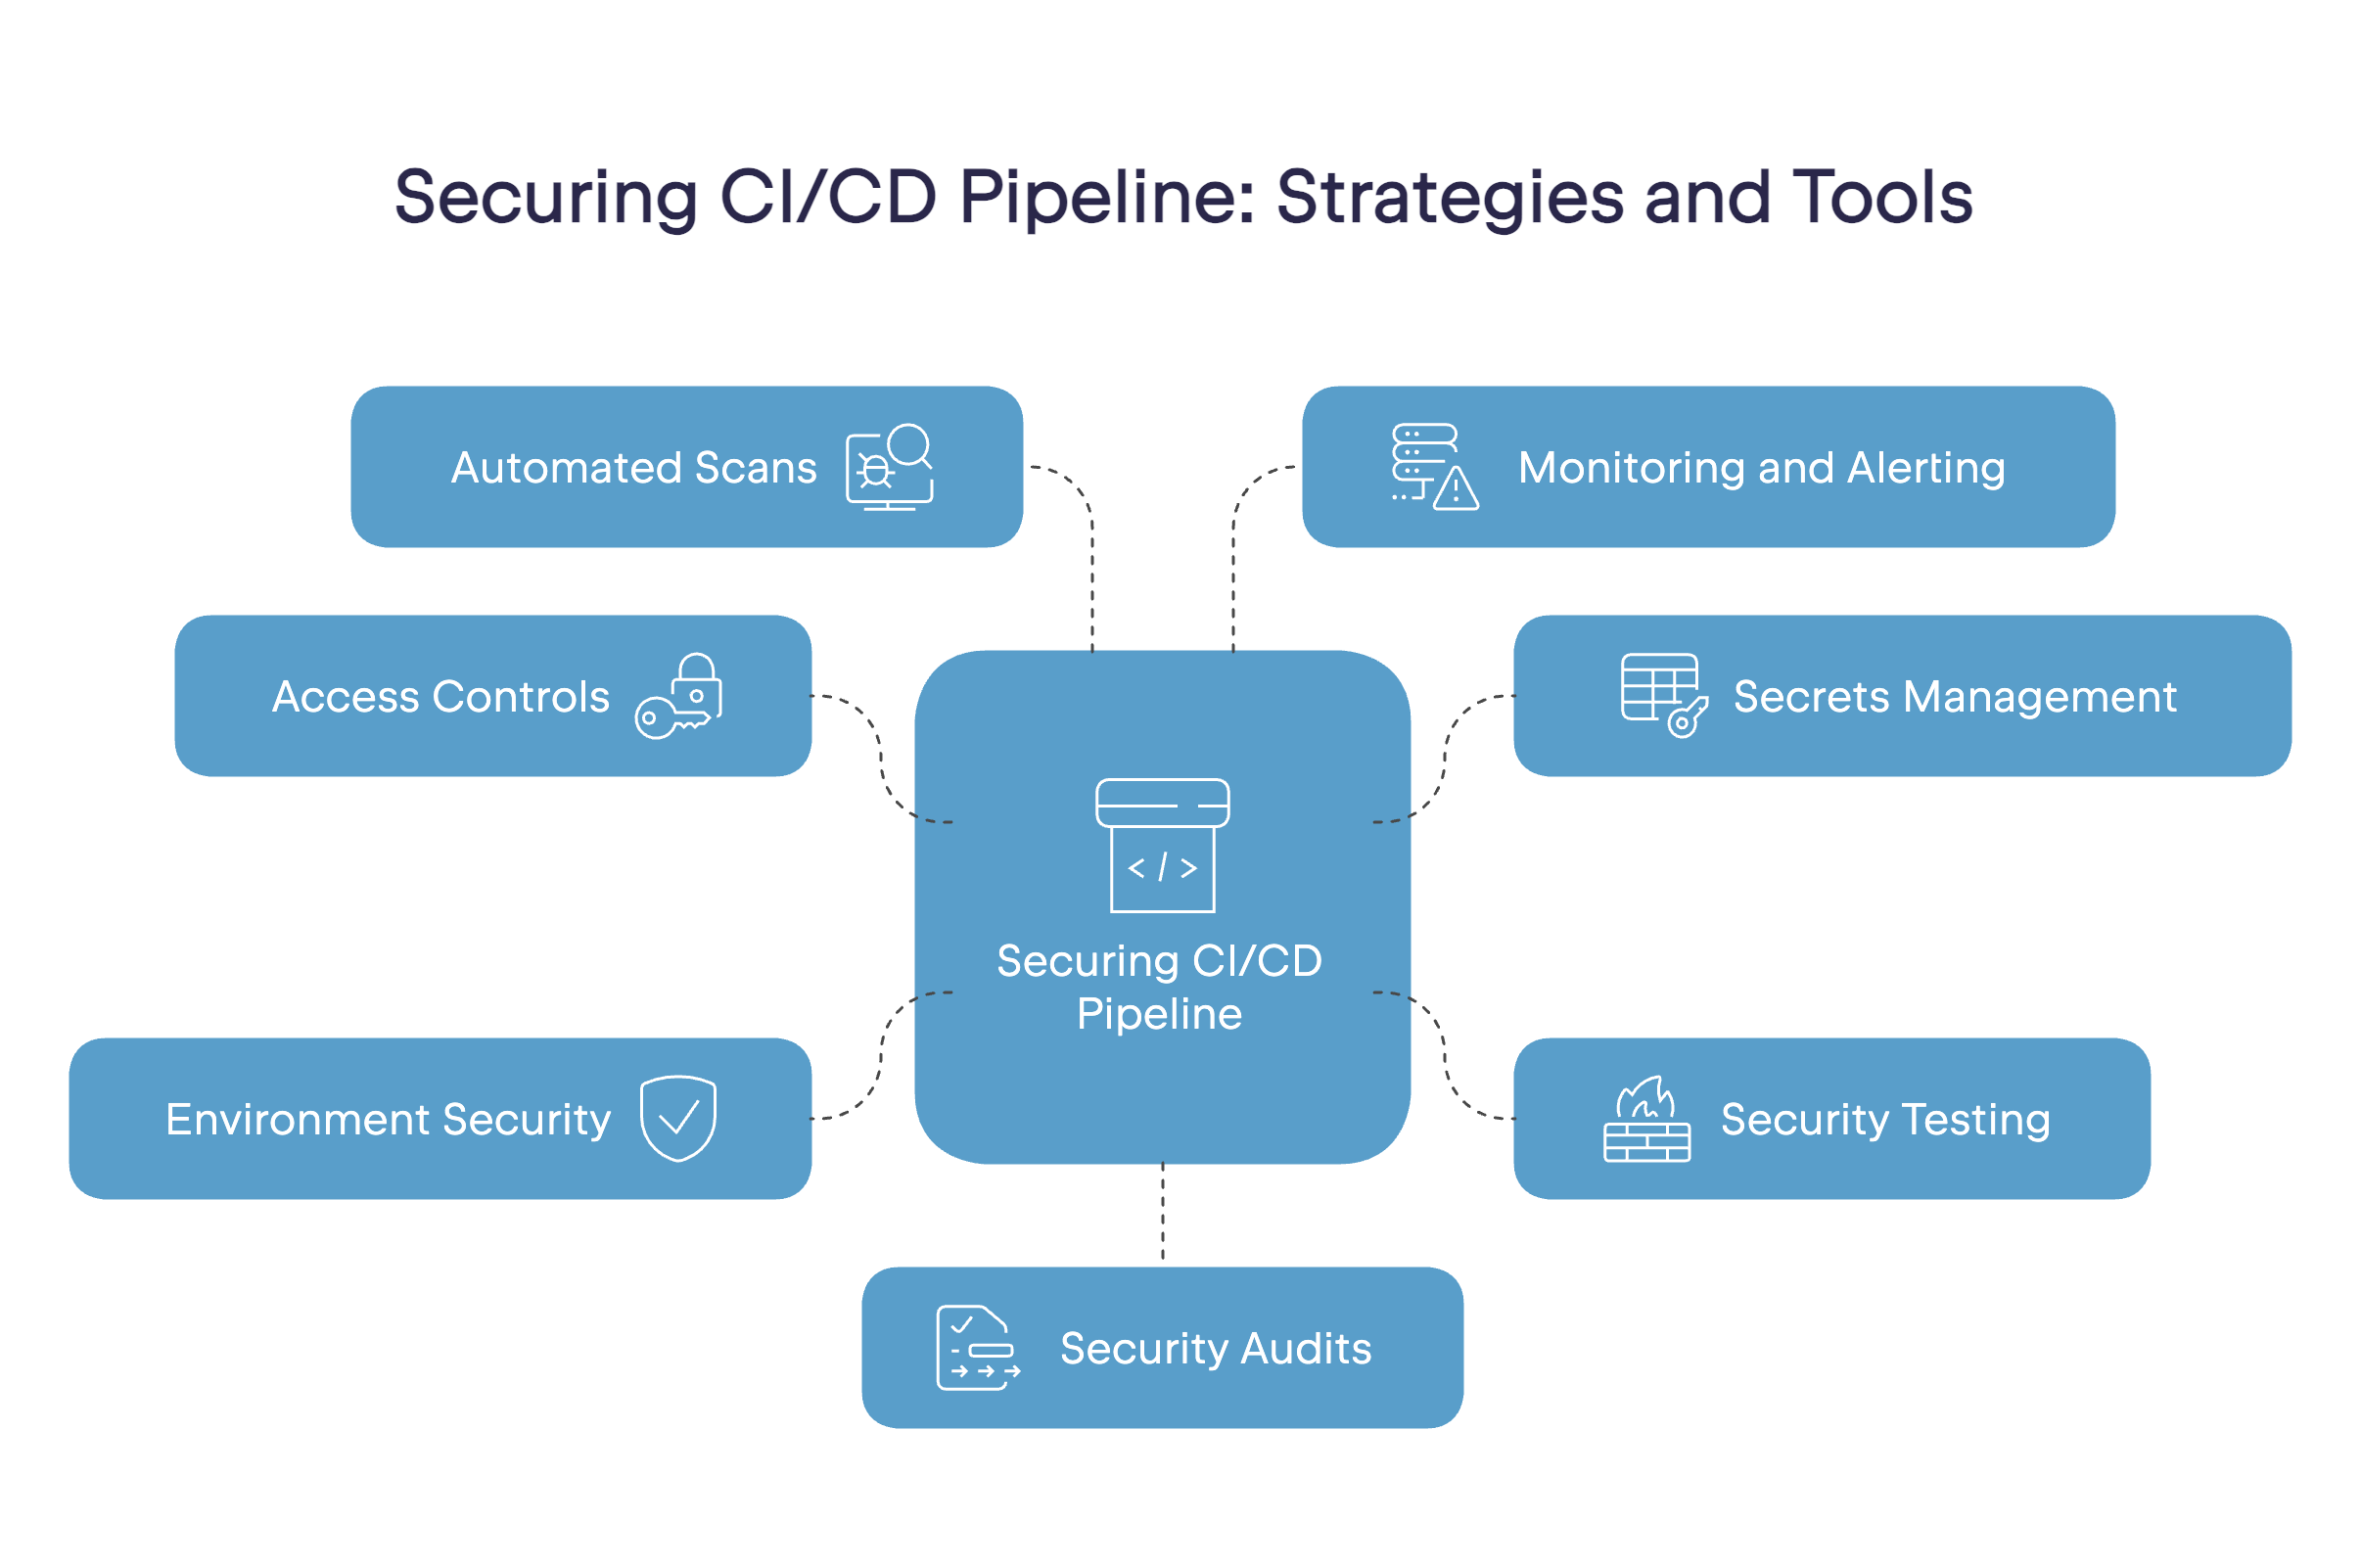
5. Security measures (code signing and access control): Make sure to configure your TeamCity instance with proper access controls, restricting access to sensitive information like signing keys to only those users who need access to the information. You should consider using a tool like HashiCorp Vault to manage and rotate all sensitive credentials that you might be using in your builds. You can check out a few other key security recommendations from TeamCity here.
Conclusion
In this article, you learned how to build and manage a detailed CI/CD pipeline for your Android development projects using JetBrains TeamCity. You explored the key stages of an Android CI/CD pipeline, from code checkout and version control integration to signing, deployment, and monitoring. You learned how TeamCity facilitates each stage and streamlines your development workflow. Toward the end, you also learned some key best practices to ensure your pipeline operates efficiently.
By using TeamCity to set up your Android pipelines, you can make your workflows significantly more efficient. This directly results in faster release cycles, fewer bugs, and ultimately, high-quality Android apps, delivered efficiently. So, take the first step towards a more streamlined development process, and start building your CI/CD pipeline today!
This article was brought to you by Mdu Sibisi, freelance writer, draft.dev.
Cloud technology has reshaped how developers manage and deliver software. For example, “serverless computing” allows a provider to dynamically manage the allocation and provisioning of servers for you, which makes it ideal for running microservices.
When paired with CI/CD practices, serverless computing can help shorten development cycles, reduce the incidence of errors, and increase the scalability of pipelines.
However, it does present some unique challenges, such as achieving comprehensive visibility, establishing secure and compliant interservice communication, and managing deployment and versioning. Many of these obstacles can be overcome using a tool like JetBrains TeamCity to integrate CI/CD with serverless computing.
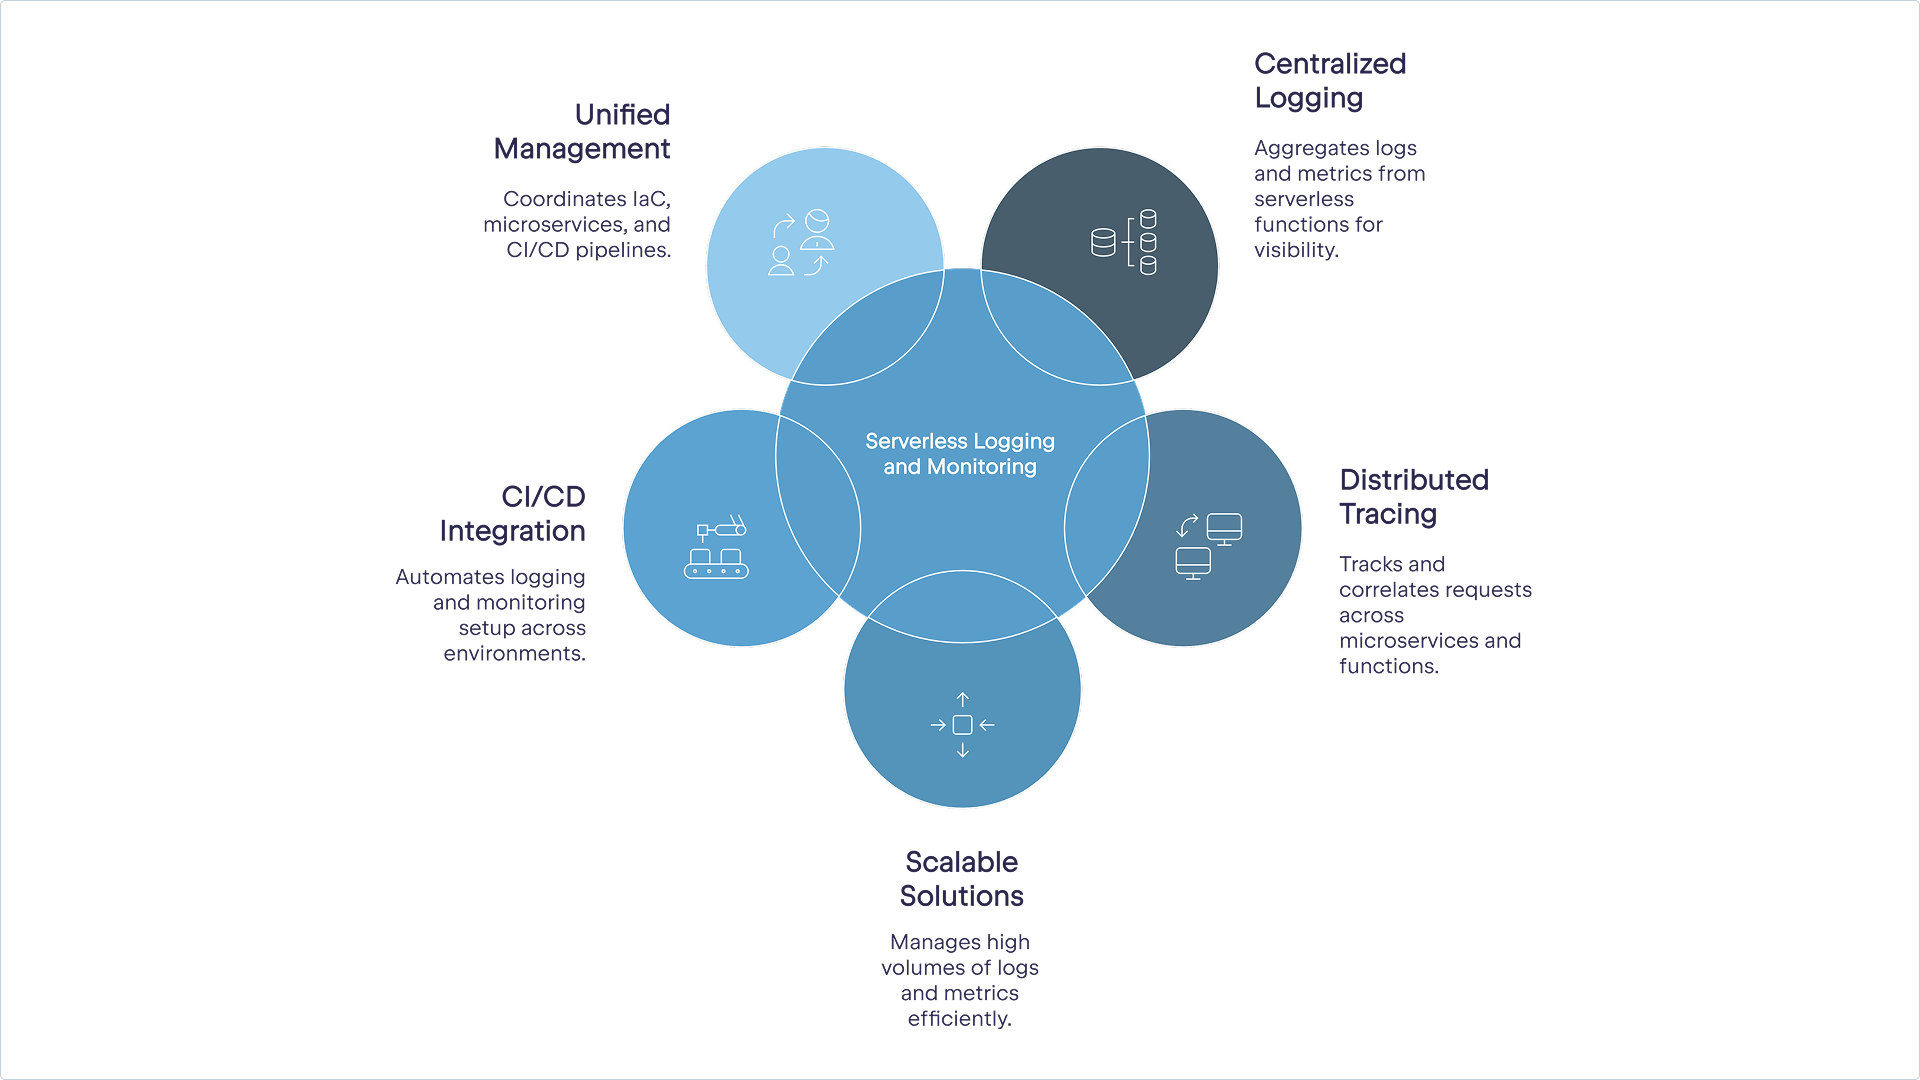
This guide explores the best practices for microservice management through CI/CD integration on serverless computing and how TeamCity can simplify the process.
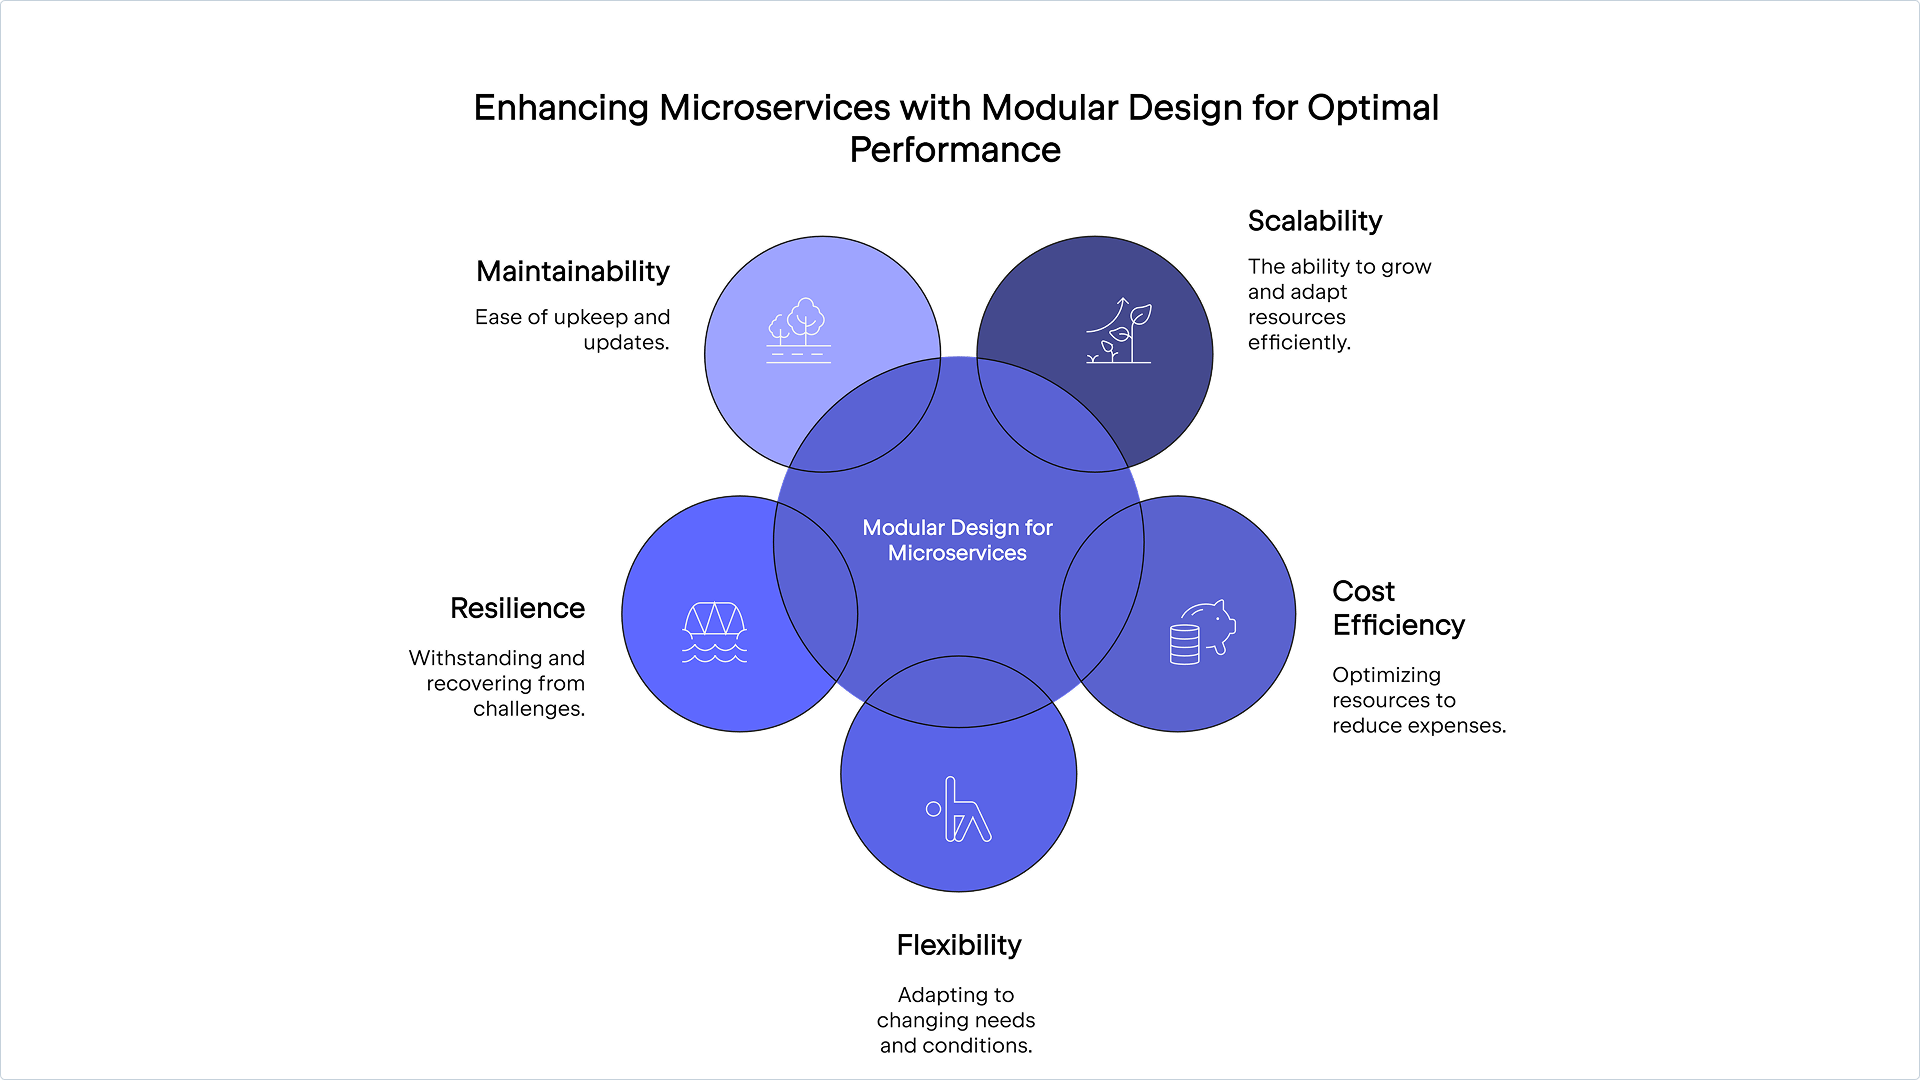
Modular design for microservices
When building microservices for serverless architecture, you should adopt a modular design to optimize compatibility with CI/CD pipelines. While alternatives like monolithic architecture, service-oriented architecture (SOA), and micro-frontend architecture each have their merits, they often introduce complexity and overhead. Modular design, on the other hand, allows you to create flexible, efficient microservices that align with serverless computing.
Modular design allows you to break an application down into smaller, independent components or microservices. A good example is how streaming services use dedicated modules or microservices for each major component, including user authentication, content management, recommendation systems, and billing.
This approach improves each component’s scalability, cost efficiency, flexibility, resilience, and maintainability.
Single responsibility principle (SRP)
Regardless of the use case, it’s crucial that your microservices align with the single responsibility principle (SRP), which states that each microservice should have a clearly defined purpose or responsibility that focuses on a specific business or usage function. This makes them easier to manage, debug, and troubleshoot.
High cohesion
To effectively implement SRP, microservices should be highly cohesive, with components closely related and working together. This improves maintainability, reduces complexity, and allows for focused testing, as each module can be tested in isolation.
Loose coupling
Loose coupling, or decoupling, means that alterations or changes in one microservice should not significantly affect another. It allows for independent development, deployment, and scaling of each service, which can often be challenges associated with running microservices on serverless architecture. Updates or changes to one module can be deployed without taking down the entire application, reducing downtime and improving availability.
Decoupling can make dependency mocking or stubbing simpler and enable you to thoroughly test each module’s functionality without relying on other services.
API-first design
To enhance cohesion and reduce coupling, adopt an API-first approach to microservice design. This involves creating a well-defined API before developing other components, which should provide consistent communication, smooth interoperability, and simplified integration. It also streamlines documentation and monitoring.
Automating builds and deployments
Automated pipelines make it easier to handle multiple microservices. You can use them to manage the build and deployment of multiple microservices simultaneously. These pipelines can also scale in response to increased demand, helping build and deployment processes remain efficient even as the number of microservices grows.
While you can write scripts and develop your own background services to manually build your pipelines, it would be far easier and more efficient to employ a tool like TeamCity, which provides a flexible, all-in-one solution to build, test, and automate deployment.
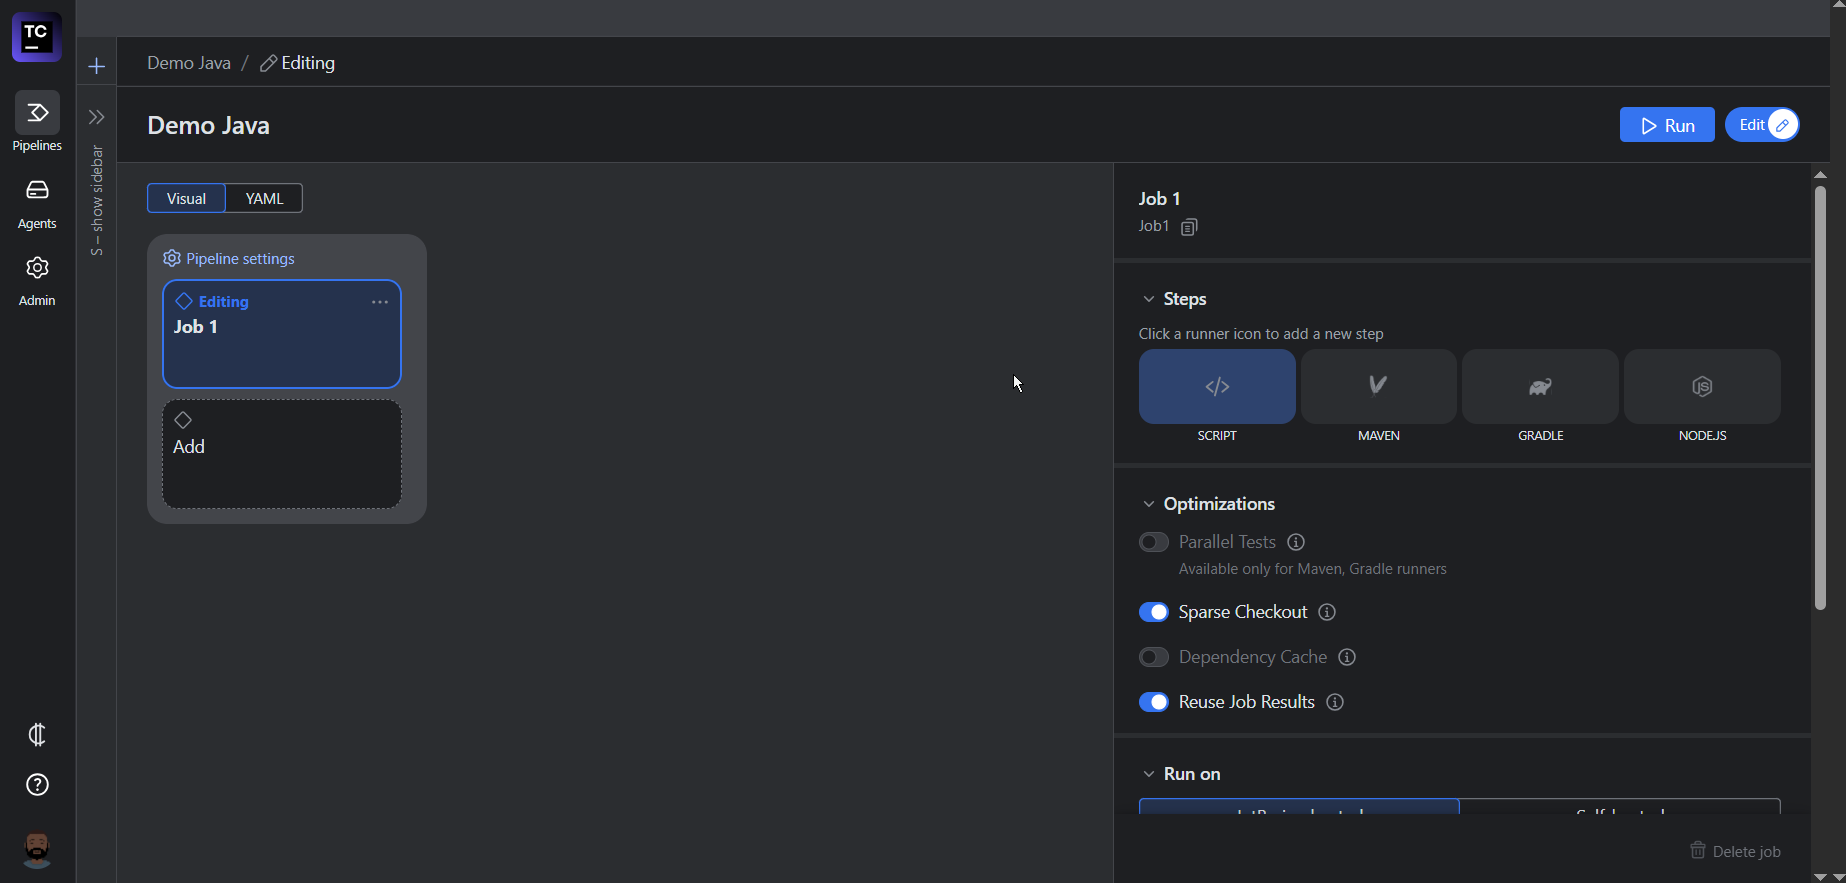
It offers multiple configuration options (most notably configuration as code) and templating. Alternatively, you can use one of TeamCity’s SaaS implementations for a web-based wizard that allows you to initialize and edit your pipelines visually.
TeamCity Pipelines interface
Version control and management
You also need a way to manage versions of serverless functions and microservices to maintain stability, backward compatibility, and smooth deployments. There are two main versioning strategies to consider:
Semantic versioning is used to indicate major, minor, and patch changes. It makes it easier to identify the impact of changes and manage dependencies.
API versioning allows you to manage changes in the API contract. You can use URL versioning (such as /v1/resource), header versioning, or query parameter versioning.
Each version of your serverless functions and microservices should be accompanied by clear and comprehensive documentation.
This must include API endpoints, request-response formats, and any changes introduced in each version. In addition, it’s important to keep a detailed changelog to track changes, bug fixes, and new features for each version. This helps developers understand the evolution of the service.
It’s good practice to ensure that your microservices are backward compatible. This helps prevent changes from breaking existing clients.
Despite your best efforts, things may still go wrong. So, establishing rollback mechanisms is important. They enable quick recovery from deployment failures by swiftly reverting to a stable version. Additionally, they give teams the confidence to experiment with new features or changes to their microservices while knowing they can easily revert if something goes wrong.
Testing strategies for serverless microservices
Testing serverless microservices can be extremely challenging due to their ephemeral nature, event-driven architecture, and distributed systems. These factors make it difficult to reproduce and debug errors, simulate events accurately, and test interactions between services.
Additionally, maintaining consistent performance, security, and compliance across multiple third-party services adds complexity. However, there are tailored strategies and tools you can adopt to help improve the quality and reliability of serverless microservices.
Unit testing
This type of granular testing focuses on assessing whether individual functions or components perform as expected in isolation. Available frameworks include Jest (JavaScript), pytest (Python), and JUnit (Java). Mocking and stubbing frameworks allow you to simulate external services and dependencies.
For instance, you can stub out external API calls and dependencies to control their behavior during testing. This helps in creating predictable and repeatable test scenarios. In addition, it’s important to write tests for all possible input scenarios.
Integration testing
Integration testing examines the interactions between different microservices and components to check that they work together correctly. Examples of available tools include Postman for API testing or integration testing frameworks like TestNG (Java) and pytest (Python).
Use integration testing to assess the communication between services, including API calls, message queues, and data stores. You can also use it to ensure data consistency and correct handling of edge cases.
End-to-end testing
End-to-end (E2E) testing involves validating the entire application workflow from start to finish to confirm that it meets business requirements. Available tools include Selenium, Cypress, and TestCafe.
You can use these tools to simulate real user scenarios and interactions, which can be crucial in making sure your serverless microservices function as they should. Fundamentally, E2E testing should be used to test the complete workflow, including authentication, data processing, and the user interface.
Simulate serverless environments
In addition to using the above approaches, it’s important to create staging environments that closely mirror your production environments. Once you establish your staging environment, deploy your serverless functions to it. You can further optimize and speed up testing by automating your staging environment integration tests.
Infrastructure as code (IaC)
IaC allows developers to define infrastructure configurations in code, which can be version-controlled and integrated into CI/CD workflows. This includes resources like serverless functions, databases, and networking components.
The typical workflow for using IaC for your infrastructure is as follows:
IaC implementation diagram
Code commit: Developers commit changes to the IaC configuration files in the version control system.
CI pipeline: The CI pipeline is triggered, running automated tests to validate the IaC code.
Approval: Once the tests pass, the changes are reviewed and approved.
CD pipeline: The CD pipeline is triggered, deploying the serverless infrastructure changes to the staging environment.
Testing: Automated tests are run in the staging environment to check that the changes work as expected.
Promotion: If the tests pass, the changes are promoted to the production environment.
Monitoring: The deployed infrastructure is monitored for performance and health, with automated alerts set up for any issues.
Manually integrating IaC with CI/CD pipelines can require significant effort and be time-consuming, especially for serverless infrastructure. This is another area where a tailored solution like TeamCity can help.
You can use it to automate builds and deployments to ensure consistent validation and packaging of IaC configurations. With support for AWS CloudFormation and Terraform, TeamCity automates resource and application deployments, enabling efficient and reliable serverless infrastructure management.
Implementing CI/CD for serverless applications comes with its own set of challenges. The following sections cover some key challenges and how they can be addressed.
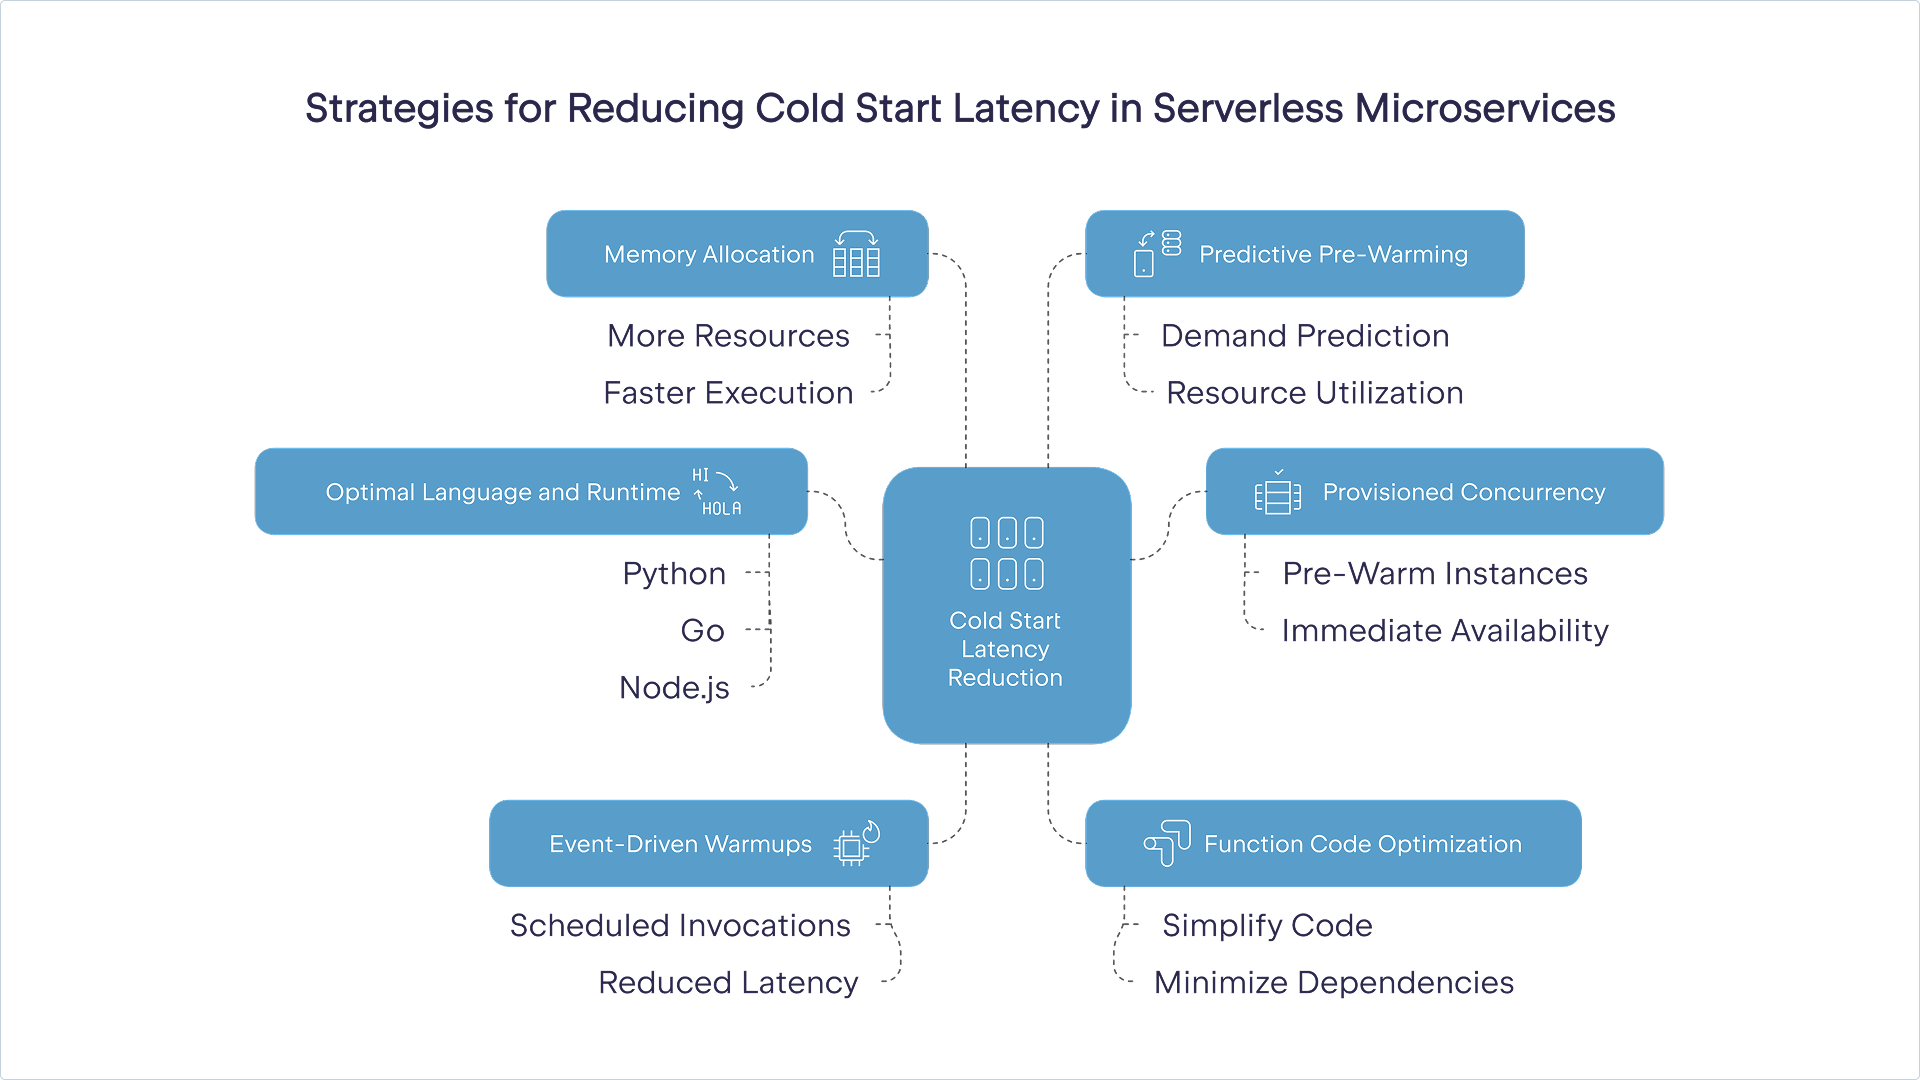
Latency related to cold starts
Serverless functions can experience latency during cold starts, which happens when they are invoked after a period of idleness. This increased latency, caused by the cloud provider provisioning necessary resources, can affect the performance and responsiveness of serverless applications, particularly in CI/CD pipelines with rapid and frequent deployments.
Some strategies you can use to address these issues include:
Using provisioned concurrency: Pre-warm a set number of function instances so they are always ready to handle requests without delay.
Preparing event-driven warmups: Use scheduled events to periodically invoke functions, keeping them warm and reducing cold start latency.
Optimizing function code and dependencies: Simplify function code, minimize dependencies, and use lightweight frameworks to reduce initialization time. For instance, remove unnecessary libraries and optimize code for faster startup times.
Choosing an optimal language and runtime: Select programming languages and runtimes with faster cold start times. Languages like Python, Go, and Node.js typically have shorter cold start times compared to Java or .NET.
Increasing memory allocation: Allocating more memory to functions can reduce initialization time, as more resources are available for execution.
Implementing predictive pre-warming: You could implement schedulers that determine the optimal number of instances to pre-warm based on predicted demand. This helps maintain a balance between resource utilization and latency reduction.
Using pre-warmed containers: Containers can be pre-warmed and kept running, reducing the cold start latency compared to traditional serverless functions. You can use AWS Fargate, Azure Container Instances (ACI), and Kubernetes with serverless frameworks to integrate containers with serverless architecture.
These strategies can minimize the impact of cold starts in serverless applications, leading to better performance and responsiveness in your CI/CD pipelines.
Dependency management
Managing dependencies for each microservice can be complex, especially when different services require different versions of the same library. Dependency management tools like npm (Node.js), pip (Python), and Maven (Java) can be used to give each microservice its own isolated environment to avoid conflicts.
Serverless functions often have deployment package size limits, which can be exceeded by large dependencies, causing deployment failures. To avoid this, optimize dependencies by including only essential libraries. Tools like webpack and Rollup can bundle and minify code, effectively reducing package size.
Dependencies can also introduce security vulnerabilities if not properly managed and updated. It’s important to regularly scan dependencies for vulnerabilities using tools like Snyk or OWASP Dependency-Check. Keep dependencies updated and apply security patches promptly to mitigate potential threats.
Environmental parity is another challenge you’re likely to run into. Ensuring that dependencies are consistent across development, staging, and production environments can be difficult.
You can use IaC to define and manage environments consistently. You can also use containerization to create a consistent runtime environment.
Observability and monitoring
Logging and monitoring are critical components of serverless architectures. They provide visibility into the performance, health, and behavior of serverless applications, enabling developers to maintain reliability, security, and efficiency. However, there are some challenges associated with logging and monitoring in serverless architecture.
For instance, because serverless functions are continuously changing, it can be difficult for observability and logging tools to capture and retain logs and metrics. Centralized logging solutions like Amazon CloudWatch, Azure Monitor, and Google Cloud’s operations suite can aggregate logs and metrics from all functions.
Serverless applications often consist of numerous microservices and functions, making it challenging to track and correlate logs across different components. You can address these shortcomings by implementing distributed tracing tools like AWS X-Ray, Azure Application Insights, or Google Cloud Trace to trace requests across multiple services and functions.
As serverless applications can scale rapidly, they generate a large volume of logs and metrics that can be difficult to manage and analyze. As such, administrators must use scalable logging and monitoring solutions that can handle high volumes of data. Implement log retention policies and use log aggregation tools to manage and analyze logs efficiently.
You can use CI/CD to feed data to monitoring systems. However, this can be challenging, especially when dealing with multiple environments and stages. It’s best to automate the setup and configuration of logging and monitoring as part of the CI/CD pipeline. IaC supports consistent configuration across environments.
It can be daunting to get all these moving parts and configurations to work together smoothly. In such instances, it’s always a good idea to use a single unifying tool to handle your IaC, microservice, and CI/CD pipeline management.
How TeamCity supports CI/CD for serverless microservices
As we already mentioned, TeamCity is a powerful CI/CD tool that can significantly streamline the process of managing serverless applications. Let’s look at a few ways it can help.
Pipeline configuration made simple
TeamCity’s visual editor provides an intuitive, drag-and-drop interface for configuring CI/CD pipelines. Changes made in the visual editor are instantly reflected in the YAML editor and vice versa.
TeamCity Pipelines interface
Along with the visual editor’s smart suggestions, the open terminal allows for easier troubleshooting and debugging. You can import existing YAML files from their repositories to make creating your pipeline easier.
TeamCity also offers robust support for IaC tools and deployment triggers. It integrates with AWS CloudFormation, Terraform, and the Serverless Framework. In addition to this, TeamCity offers a large variety of build triggers, including version control system (VCS), schedule, and dependency triggers.
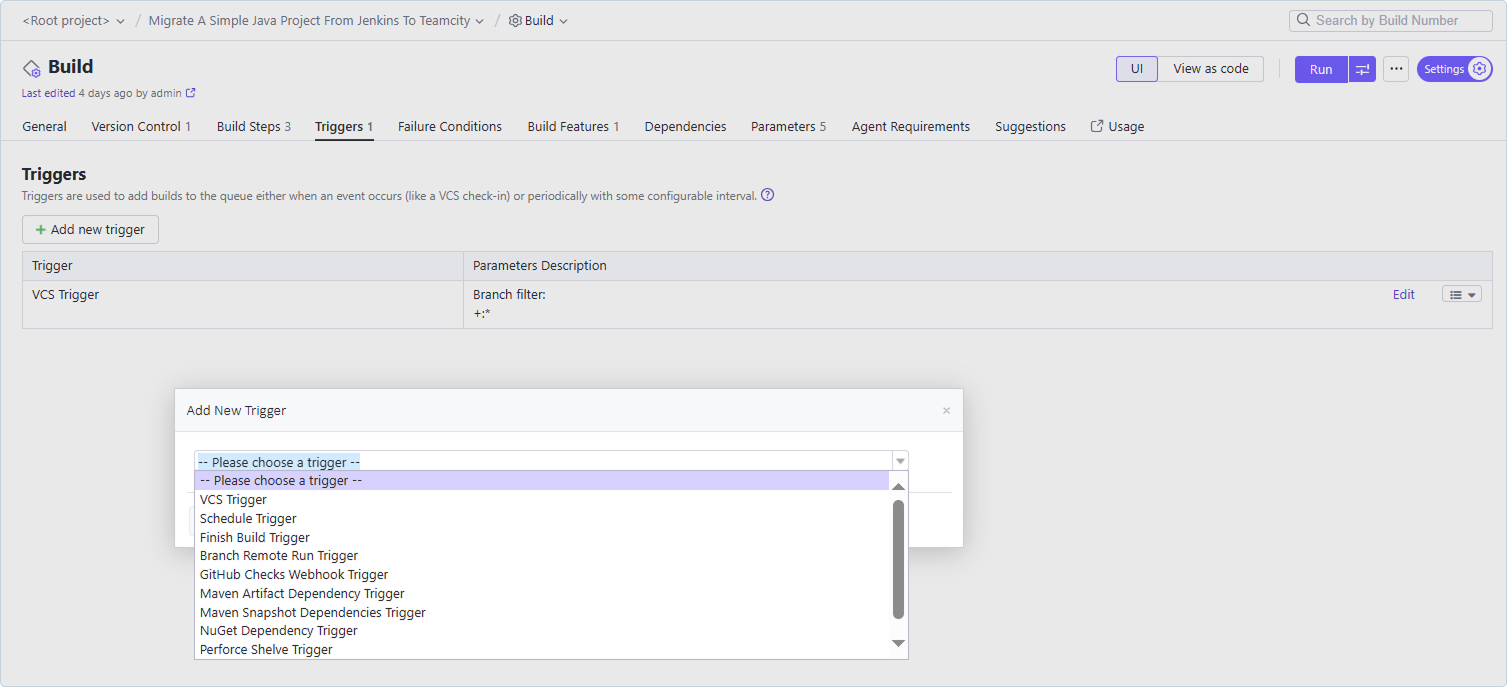
The basic YAML configuration for a VCS trigger in TeamCity typically follows this structure:
The vcs section defines the version control settings, including the repository URL and the branch to monitor. The steps section defines the build and deployment steps using Gradle. The triggers section defines a VCS trigger that initiates the build and deployment process whenever there is a commit to the main branch. Any changes committed to the main branch will automatically trigger the build and deployment process in TeamCity.
Testing and feedback integration
TeamCity offers support for a variety of testing frameworks. This includes common unit testing, integration testing, and E2E testing frameworks. TeamCity can run these tests in cloud-based environments, ensuring your serverless functions are tested in conditions that closely resemble production.
Additionally, TeamCity allows you to run tests in parallel, which can be especially useful for large projects with extensive test coverage. The platform’s real-time notifications inform you of your build or test status through channels like email, Slack, and webhooks.
Flexibility and scalability
TeamCity’s distributed build agents allow it to facilitate flexible and scalable infrastructure and workflows. For instance, you can configure elastic build agents that can be dynamically provisioned and de-provisioned based on workload. This allows the system to scale up to handle peak loads and scale down during off-peak times, optimizing resource usage and cost.
By using multiple build agents, the platform can make sure that the failure of a single agent does not disrupt the entire CI/CD pipeline. Other agents can take over the tasks, maintaining the continuity of the build process. TeamCity can automatically detect and recover from agent failures, restarting builds on available agents and minimizing downtime.
But how does a typical deployment look in TeamCity? What makes it any different than setting up or creating your own system?
Deploying a serverless microservice
Developing your application using microservices already requires a lot of cognitive overhead. Setting up a system to deploy it on serverless architecture shouldn’t be as energy-consuming.
TeamCity is relatively easy to set up. You can build, test, and deploy a serverless application using the following steps:
In TeamCity, create a new project for your serverless application.
Connect your project to a VCS to track your code changes.
Add build steps to compile your serverless application. For example, if you’re using the Serverless Framework, you might add a step to run serverless package.
Ensure that all dependencies are installed. For Node.js applications, you might add a step to run npm install.
Add build steps to run unit tests using your preferred testing framework (such as Jest, Mocha, or pytest).
Add steps to run integration tests to check that different components of your application work together correctly.
Add steps to run end-to-end tests to validate the entire application workflow.
Add build steps to deploy your serverless application. For example, if you’re using the Serverless Framework, you might add a step to run serverless deploy.
Configure environment variables required for deployment, such as AWS credentials or API keys.
Configure VCS triggers to automatically start the build and deployment process whenever changes are committed to the repository.
Monitor the build and deployment process in real time through the TeamCity interface.
Review detailed test reports to identify and fix any issues.
Check deployment logs to confirm the application was deployed successfully.
Emerging trends in CI/CD for serverless microservices
Advancements in CI/CD for serverless microservices are shaping the future of software development. Two of the key emerging trends in CI/CD are event-driven pipelines for automation and AI.
Event-driven CI/CD pipelines enhance the efficiency and responsiveness of the software development lifecycle. These pipelines react to specific events, such as code changes, feature requests, or system alerts.
For instance, triggers can come in the form of HTTP requests made to specific endpoints. In cases where an external system or service needs to initiate a build or deployment, it can send a request to the CI/CD pipeline’s API endpoint. TeamCity is well equipped to manage event-driven workflows, enhancing the automation and responsiveness of CI/CD pipelines.
AI is also revolutionizing CI/CD pipelines by introducing advanced optimization techniques that enhance efficiency, reliability, and speed. AI algorithms in predictive build optimization analyze historical build data to predict the likelihood of build failures. When used appropriately, it can improve overall resource utilization.
In addition to the above, AI can make software testing more robust and reliable. TeamCity can be integrated with AI-powered tools that can analyze code quality and suggest improvements. One example of such a tool is SonarQube, which can perform static code analysis and provide code improvement suggestions through its AI Code Fix tool.
Conclusion
Aligning CI/CD practices with serverless computing can help you optimize the microservice deployment. However, it does present some unique challenges, which can be overcome by following the best practices highlighted in the above guide. Tools like TeamCity make it far easier and more manageable to implement these strategies and practices.
The platform offers 14-day trials for its SaaS implementations and a 30-day trial for its On-Premises Enterprise edition. Once you’ve decided on an implementation, learn how to configure your serverless CI/CD pipeline using configuration as code through Terraform or learn how to integrate it with Kubernetes.
TeamCity is a flexible solution that makes configuring and managing CI/CD in serverless environments easier.
This tutorial was brought to you by Rajkumar Venkatasamy, draft.dev.
Microservice architecture has become a cornerstone for building scalable and maintainable applications. Microservices allow individual services to be developed, deployed, and scaled independently, resulting in faster delivery cycles and improved fault isolation.
For example, an e-commerce platform can use independent services to handle product catalogs, user authentication, and order management. By breaking large applications into smaller, independent services, organizations can address challenges such as long development cycles, difficulty in scaling specific components, and the risk of a single failure affecting the entire application.
In enterprise applications, microservices make it easier to quickly update and scale specific parts of the system. This allows teams to improve features without affecting the entire application. Automated testing and deployment of service components increase reliability, catching potential issues early and maintaining system stability.
Microservices also streamline the DevOps workflow, allowing for faster time-to-market by reducing the complexity of deployments and leveraging continuous integration and continuous deployment (CI/CD) pipelines. These pipelines play a critical role in managing the lifecycle of microservices from development to deployment, ensuring consistent and efficient delivery processes.
In this tutorial, you’ll learn how to create a microservice using Spring Boot, set up a CI/CD pipeline with JetBrains TeamCity, and automate deployment using Docker.
Microservice overview and prerequisites
Imagine you’re developing an inventory management system where each microservice handles a specific function, such as managing products, orders, or customers. In this tutorial, you’ll build a “Product Service” microservice that provides RESTful APIs to create and list products.
Architecture diagram
You’ll need the following to complete this tutorial:
Exposure to Java programming and JDK 21 or higher.
Familiarity with Spring Boot, particularly using Spring Initializr for generating and working with Spring Boot projects.
TeamCity. This tutorial uses the on-premises version of TeamCity running on a Windows machine as a Windows service. However, you can use whichever TeamCity version you prefer.
You’ll be directed to the Spring Initializr dashboard:
Spring Initializr
Click GENERATE to download the Spring Boot project. Extract the project in the directory where you cloned your GitHub repository. Then, open the project in your favorite IDE (such as IntelliJ IDEA) and edit the pom.xml file to include the following dependency:
The above changes need to be done in your pom.xml file to bring in the Mockito library, which enables you to use mocking in your unit tests. <scope>test</scope> ensures that Mockito is only used during testing and not included in the final application build, as it’s not required while the application is run.
If you want to explore the pom.xml file in its entirety or reference the source code of this tutorial, you can visit this GitHub repository.
Implement a RESTful API for the product service
When complete, the demo application will have two APIs: one that allows the user to create a product and one that will fetch the created products.
Create a product entity class
Begin by creating an entity class called product.java inside the com.example.demo package under the src directory. This entity class maps the product information to the underlying table definition:
package com.example.demo;

import jakarta.persistence.Entity;
import jakarta.persistence.GeneratedValue;
import jakarta.persistence.GenerationType;
import jakarta.persistence.Id;

@Entity
public class Product {
    @Id
    @GeneratedValue(strategy = GenerationType.IDENTITY)
    private Long id;
    private String name;
    private double price;

    public Product(Long id, String name, double price) {
        this.id = id;
        this.name = name;
        this.price = price;
    }

    public Product() {
    }

    // Getters and setters

    public Long getId() {
        return id;
    }

    public void setId(Long id) {
        this.id = id;
    }

    public String getName() {
        return name;
    }

    public void setName(String name) {
        this.name = name;
    }

    public double getPrice() {
        return price;
    }

    public void setPrice(double price) {
        this.price = price;
    }
}
The @Entity annotation indicates that this is an entity class and is referring to a database table. The @Id annotation indicates the primary key of the product entity and @GeneratedValue holds the technique by which the values of the primary keys will be generated.
Create a product repository class
Next, create a product repository class called ProductRepository.java in the same com.example.demo package. You’ll need the repository class to store, manipulate, and retrieve the persisted product information from the underlying table. The @Repository Spring annotation helps you achieve this:
Create a ProductController.java class inside the same com.example.demo package. Below is the source code for the controller class file, which includes the @Autowired product repository class and calls the methods that create or fetch product information in their respective APIs:
package com.example.demo;


import org.springframework.beans.factory.annotation.Autowired;
import org.springframework.web.bind.annotation.*;

import java.util.List;

@RestController
@RequestMapping("/products")
public class ProductController {
    @Autowired
    private ProductRepository repository;

    @GetMapping
    public List<Product> getAllProducts() {
        return repository.findAll();
    }

    @PostMapping
    public Product createProduct(@RequestBody Product product) {
        return repository.save(product);
    }
}
That’s all for the core application logic.
Create a test class
The next step is to create a test class to test the API methods defined in the controller class.
Create a test class named ProductControllerTest.java under the test directory and within the package com.example.demo. Paste in the following code, which contains the logic to test the product creation and retrieval methods:
Now that the application source code is ready, open a terminal and switch to the project directory containing the entire application code. Execute the following command to compile and build the application:
mvnw clean install
You should see an output similar to the following, indicating that the build has started and completed successfully:
[INFO] Scanning for projects...
[INFO]
[INFO] --------------------------< com.example:demo >--------------------------
[INFO] Building demo 0.0.1-SNAPSHOT
[INFO]   from pom.xml
[INFO] --------------------------------[ jar ]---------------------------------
[INFO]
[INFO] --- clean:3.4.0:clean (default-clean) @ demo —

…
…
…

[INFO] ------------------------------------------------------------------------
[INFO] BUILD SUCCESS
[INFO] ------------------------------------------------------------------------
[INFO] Total time:  9.064 s
[INFO] Finished at: 2025-01-05T10:57:04+05:30
[INFO] ------------------------------------------------------------------------
Test the APIs locally
You can test the APIs locally using any of your favorite API testing tools. To test the product creation, make a POST request to the products endpoint at http://localhost:8080/products with the following request body:
{
    "name": "product-1",
    "price": 14.20
}

You should get this JSON response:
{
    "id": 1,
    "name": "product-1",
    "price": 14.2
}

You can make another similar POST request with the request body below to create another product:
{
    "name": "product-2",
    "price": 20
}
Next, test the product information retrieval API by making a GET request to the products endpoint at http://localhost:8080/products. You should see a response body with the details of the product information created earlier:
To set up a CI/CD pipeline for your product microservice with TeamCity, you need to push your project source code into a version control repository like GitHub. Commit and push your changes to your GitHub repo by executing the following command from a terminal opened in the project directory:
You’ve now tested your application locally and pushed the source code to GitHub.
Create a project in TeamCity
Let’s move on to integrating your application with TeamCity.
First, ensure that both the TeamCity server and agent services are running. If you’re using Windows, you can execute the following command in a PowerShell terminal:
Get-Service -Name "TeamCity"
You should see this output:
Status   Name               DisplayName
------   ----               -----------
Running  TeamCity           TeamCity Server
Execute the following command:
Get-Service -Name "*BuildAgent*"
You should see this output:
Status   Name               DisplayName
------   ----               -----------
Running  TCBuildAgent       TeamCity Build Agent
Then, open a browser and access http://localhost:8111/. Log in to the TeamCity portal with the username and password that you specified when installing TeamCity:
TeamCity login page
Once you’re logged in, click Create project… to create a new project in TeamCity:
Create Project form
Once the TeamCity server is able to connect with your GitHub repository, you should see a screen indicating the connection to the repository has been verified:
Connection verified message
Leave the details as is and click Proceed.
Configure build steps
After clicking Proceed, you’ll be redirected to a screen where TeamCity will automatically detect certain build steps based on your project files:
Auto-detected build steps
Select the Docker and Maven build steps as shown below and click Use selected:
Use selected build steps
The selected build steps will be added and displayed on the next screen:
Build steps
Click Edit on the “Maven” build step to view its details. Here, you can enter “Build application using Maven” (or anything else you like) as the step name. Leave all other settings as their default values and click Save:
Maven build step
You should see a message indicating that your build step was successfully updated:
Success message for edited Maven build step
Next, click Edit for the “Docker” build step. Enter a custom step name (something like “Build Docker Image”) and fill in the Image name:tag field to build the Docker image with the given name and tag. Leave the other default values as they are and click Save:
Docker build step
You should see a message indicating that your build step was successfully updated:
Success message for edited Docker build step
Click the drop-down menu to the right of the second build step and select Copy build step… to duplicate the step:
Copy build step
On the form that appears, accept the default values shown by clicking Copy:
Pop-up form
You should see a message confirming your action was successful:
Success message for copied build step
Next, edit the newly copied step. Enter a new step name (something like “Push Docker Image”), then select push as the Docker command option to indicate that the image has to be pushed using the docker push command:
Push Docker Image step
After clicking Save, you should see a message indicating that your edit was successful:
Success message for edited build step
Next, copy the “Push Docker Image” step by repeating the instructions from earlier:
Success message for copied build step
Click Edit next to the newly created step. Enter something like “Deploy Docker Image and Run the App” as the step name, then select other as the Docker command option and enter run in the Command name field. For additional arguments for the command, enter --name demo-app -p 8080:8080 -d <your_docker_repository_name>/<your_image_name>:<your_tag_name>.
Deployment step
The deployment step defined above will pull the Docker image from the Docker Hub registry to the target machine (your local machine, in this case) and start the application container.
After you click Save, you should get confirmation that your last edit action was successful.
Now, click the project name displayed at the top to go to the project details screen:
Click project name
ClickConnections on the left:
Project details screen
Click Add Connection to define a new connection with the details pertaining to your Docker Hub account:
Add connection
This is a required step to enable the build pipeline to perform Docker-oriented actions that you configured as part of earlier build steps.
On the form that appears, select Docker Registry as the connection type, then enter your Docker Hub account credentials:
Docker registry credentials
Click Save. You should get confirmation that the connection was successfully created.
Next, click Go to project page in the top-right hand side of the screen to navigate back to the project page:
Go to project page
Click Build:
Project page
Click Edit configuration… at the top:
Edit build configuration
Click Build Features in the left menu:
Click Build Features
Click Add build feature:
Add build feature
Select Docker Support as the build feature, then click Add registry connection:
Link registry connection with Docker Support feature
Choose the configured Docker Registry connection from the drop-down menu, then click Add to link the registry connection. This informs the pipeline that it has to use the Docker Support feature and the linked registry connection as part of the relevant Docker steps.
Add registry connection
Finally, click Save to save the added Docker Support build feature:
Save Docker Support feature
You’ll get a message confirming that the build feature has been added successfully. By default, TeamCity adds another build feature to carry out performance monitoring when the build is executed. As part of this feature, performance statistics (such as CPU, disk, and memory utilization) will be tracked and registered during the build runs.
Run the build
Everything is now set up, and you can click Run to run the build:
Run the build
Once the build is completed, you’ll see a screen indicating that the build run was successful.
Click Show full log to view the build run log information:
Successful build run
This is handy for troubleshooting any build failures. You can also click the PerfMon tab to view the performance statistics collected during the build run:
Performance statistics
In addition to resource utilization statistics, the screen will also show you the elapsed time for each build stage. You can see which of the build stages took the most time to execute and make the necessary adjustments to address the performance issue.
You should also see that the published Docker image is now available in the Docker Hub registry:
Published Docker image in Docker Hub
You can now test the application to ensure the Docker container started via the automated build and deployment pipeline process works as expected. For testing, follow the same steps as before when you tested the APIs locally.
Final thoughts
In this tutorial, you explored how to build and deploy microservices using Spring Boot and TeamCity. You learned how to create a simple Spring Boot application, implement microservices, and integrate them with a CI/CD pipeline to streamline the deployment process.
By adopting a microservices architecture and leveraging robust tools for automation, you can accelerate development cycles, enhance reliability, and achieve seamless scalability for your applications. These principles and practices are essential for modern software development in enterprise and cloud-native environments.
TeamCity helps simplify and enhance CI/CD workflows for microservices. With features like build automation, support for distributed builds, and seamless integration capabilities, TeamCity enables teams to manage complex pipelines with ease. Its scalability ensures it can handle growing workloads, while its robust ecosystem of plugins supports diverse use cases.
If you’re ready to elevate your CI/CD processes, try TeamCity for free and experience its capabilities firsthand. Get started today and unlock the potential of faster, more reliable software delivery.
Software development moves fast – really fast. It can also involve multiple teams working from different locations around the world. However, while speed and collaboration can be great for developers and businesses, they can also create security challenges.
With more entry points and less time to catch potential threats, each commit, build, and deployment is another opportunity for something to go wrong. Whether that’s a security breach, malicious attack, or accidental exposure, the impact can ripple through your chain and burden every application.
That’s where CI/CD security comes in. Learn what securing your CI/CD pipeline means for your team, the main risks you need to be aware of, and the practical steps to safeguard your flow.
What is CI/CD security, and why is it important?
CI/CD security is a set of practices and controls that protects the entire software delivery process. It prioritizes keeping your code safe from the very start, is built in rather than a separate phase, and is integral to DevSecOps.
Your CI/CD pipeline has access to tons of sensitive information, including codebases, credentials, and production environments. If compromised, attackers could inject malicious code, steal data, or even gain access to your systems (as they did in the SolarWinds attack).
Aside from these catastrophic breaches, proper CI/CD security helps prevent mistakes, which could expose sensitive data or introduce vulnerabilities. Malicious employee or contractor behavior shouldn’t be overlooked here, either – 20% of businesses cited this as a cause of their data breaches. CI/CD security is both a shield and a safety net in one.
With development automation, changes can go from a laptop to production in minutes, and CI/CD security needs to ensure it doesn’t slow down the process. Acceleration is great for business agility, but giving attackers a fast track to your systems is hazardous. In fact, less than 10% of companies in 2022 had implemented hack monitoring in their software development lifecycle.
However, get CI/CD security right, and you can have both speed and reliability.
CI/CD pipeline security threats
Your CI/CD pipeline has several potential weak points, including:
Source-code repositories: Where your application code and configuration files live, the starting point of your pipeline.
Build servers: The systems that compile your code, run tests, and package your applications. They handle sensitive operations and often have elevated privileges.
Artifact storage: Where your compiled applications, container images, and packages are stored before deployment.
Deployment environments: The staging and production systems where your applications run (including cloud platforms and traditional servers).
These components face threats from various angles, such as:
Supply chain attacks: Harmful code can sneak in through compromised third-party tools, libraries, or dependencies used in your application.
Stolen passwords and secrets: Attackers may find exposed credentials in pipeline configurations or scripts. These threats can take a long time to identify and contain – 292 days, according to one report.
Configuration mistakes: Small errors in setup can enable attackers to bypass security or gain more access than they should have.
Insider threats: Developers with pipeline access might accidentally or intentionally introduce vulnerabilities.
Server breaches: Attackers can get access to the computers that run your build and deployment process.
The interconnected nature of CI/CD means that compromising just one part can affect everything in the system.
Tips for securing your CI/CD pipeline
The most effective CI/CD security involves building multiple layers of protection throughout your pipeline. Rather than implementing a single tool or simply following a checklist, you should set up security checkpoints at every stage.
Employ CI/CD access controls
Protect your pipeline by implementing strict access controls and applying the principle of least privilege.
Use role-based access control (RBAC) to ensure team members only have the access they absolutely need for their specific roles. To prevent unauthorized code changes, set up mandatory code reviews, enable branch protection rules, and use signed commits.
Remember to regularly audit these permissions and remove access when team members leave.
Manage secrets effectively
Never, ever hardcode credentials into your pipeline configurations or code. Instead, use dedicated secrets management tools (such as HashiCorp Vault) to securely store and manage sensitive information.
Rotate these credentials regularly (ideally automatically) and ensure secrets are encrypted both in transit and at rest. It’s also best to use temporary credentials where possible.
Integrated security testing
Make security testing a natural part of your pipeline by putting multiple testing layers in place.
Certain tools can help you catch vulnerabilities before they reach production:
Configure these tests to run automatically with each build and block deployments if any security issues are found.
Secure the development and deployment environment
Ensure your build environments are as secure as your production systems – they’re just as important, if not more.
Harden your build servers by removing unnecessary services, keeping systems patched, and using minimal base images. Implement network segmentation to isolate build environments from each other and other systems.
If you can, consider using temporary infrastructure. This method allows you to create fresh environments for each build and destroy them afterward.
Automate security scans
Set up automated security scanning throughout your pipeline. Use container scanners to check for vulnerabilities in container images, dependency checkers to identify known vulnerabilities in libraries, and registry scanners to ensure the security of stored artifacts.
Establish vulnerability thresholds (what level is considered suspicious or a threat) and automatically stop deployments that don’t meet your security standards. Schedule regular scans of your artifacts to ensure you’re aware of new or emerging vulnerabilities.
Monitor and alert
Implement comprehensive monitoring for your CI/CD pipeline. Track all activities and watch for unusual patterns like builds at odd hours, unexpected configuration changes, strange resource usage, and deployment events.
Use detailed logging and set up alerts, making sure your team knows how to respond if something suspicious is found. Security information and event management (SIEM) are great CI/CD security tools – they correlate security events and enable real-time threat detection and response.
Perform regular security audits and assessments
Regularly test your CI/CD pipeline security using different methods:
Penetration testing identifies potential vulnerabilities before attackers do.
Red team exercises simulate ‘real’ attacks, while blue team exercises let you practice your incident response.
Purple team exercises are used to improve both your offensive and defensive capabilities.
Check your compliance with your local security standards and regulations, and update your controls based on the results of your assessments.
How TeamCity can help
Security in your CI/CD pipeline is a must for protecting your software supply chain. While the threats are real, with the right tools and practices, you can build and deploy software securely without slowing down your team or minimizing their efforts.
TeamCity makes this easier with security features that grow with your needs.
Junie is an intelligent coding agent developed by JetBrains. It automates the full development loop: reading project files, editing code, running tests, and applying fixes, going far beyond simple code generation.
Similar to how developers use tools like ChatGPT to solve coding problems, Junie takes it a step further by automating the entire process.
As the agent’s architecture evolved, the team needed a secure, robust way to measure progress. They wanted to build a scalable, reproducible evaluation pipeline that would be able to track changes across hundreds of tasks.
That’s where TeamCity came in. Junie’s development team uses TeamCity to orchestrate large-scale evaluations, coordinate Dockerized environments, and track important metrics that guide Junie’s improvements.
The challenge
Validating agent improvements at scale
As Junie’s agents became more capable, with new commands and smarter decision-making, every change needed to be tested for real impact. Evaluation had to be systematic, repeatable, and grounded in data.
“Did it get better or not?’ is a very poor way to evaluate. If I just try three examples from memory and see if it got better, that leads nowhere. That’s not how you achieve stable, consistent improvements. You need a benchmark with a large and diverse enough set of tasks to actually measure anything.”
Danila Savenkov, Team Lead, JetBrains Junie
The team identified five core requirements for this process:
Scale: Evaluations had to cover at least 100 tasks per run to minimize statistical noise. Running fewer tasks made it hard to draw meaningful conclusions.
Parallel execution: Tasks needed to be evaluated in parallel, as running them sequentially would take over 24 hours and delay feedback loops.
Reproducibility: It had to be possible to trace every evaluation back to the exact version of the agent, datasets, and environment used. Local experiments or inconsistent setups were not acceptable.
Cost control: Each evaluation involved significant LLM API usage, typically costing USD 100+ per run. Tracking and managing these costs was essential.
Data preservation: Results, logs, and artifacts needed to be stored reliably for analysis, debugging, and long-term tracking.
Benchmarking with SWE-bench
For a reliable signal, Junie adopted SWE-bench, a benchmark built from real GitHub issues and PRs. They also used SWE-bench Verified, a curated 500-task subset validated by OpenAI for clarity and feasibility.
In parallel, Junie created in-house benchmarks for their internal monorepo (Java/Kotlin), Web stack, and Go codebases, continuously covering more languages and technologies by the benchmarks.
The operational challenge
Running these large-scale evaluations posed operational challenges:
Spinning up consistent, isolated environments for each task.
Managing dependencies and project setups.
Applying patches generated by agents and running validations automatically.
Collecting structured logs and metrics for deep analysis.
Manual workflows wouldn’t scale. Junie needed automation that was fast, repeatable, and deeply integrated into their engineering stack.
TeamCity enabled that orchestration. With it, the Junie team built an evaluation pipeline that is scalable, traceable, and deeply integrated into their development loop.
The solution
To support reliable, large-scale evaluation of its coding agents, Junie implemented an evaluation pipeline powered by TeamCity, a CI/CD solution developed by JetBrains.
TeamCity orchestrates the execution of hundreds of tasks in parallel, manages isolated environments for each benchmark case, and coordinates patch validation and result collection.
“If we tried running this locally, it just wouldn’t be realistic. A single evaluation would take a full day. That’s why we use TeamCity: to do everything in parallel, isolated environments, and to ensure the results are reproducible.”
Danila Savenkov, Team Lead, JetBrains Junie
The setup enables the team to trace outcomes to specific agent versions, gather detailed logs for analysis, and run evaluations efficiently, while keeping infrastructure complexity and LLM usage costs under control.
Execution pipeline design
At the heart of the system is a composite build configuration defined using Kotlin DSL, which gives Junie full control over task orchestration. Each top-level evaluation run includes multiple build steps.
Example of a build chain in TeamCity
Environment setup
Each coding task is paired with a dedicated environment, typically a pre-built Docker container with the necessary dependencies already installed. This guarantees consistency across runs and eliminates local setup variability.
Agent execution
Junie’s agent is launched against the task. It receives a full prompt, including the issue description, code structure, system commands, and guidelines. It then autonomously works through the problem, issuing actions such as file edits, replacements, and test runs.
The final output is a code patch meant to resolve the issue.
Patch evaluation
The generated patch is passed to the next build step, where TeamCity applies it to the project and runs the validation suite. This mimics the GitHub pull request flow – if the original tests were failing and now pass, the task is marked as successfully completed.
Metric logging
Execution metadata, including logs, command traces, and success/failure flags, is exported to an open-source distributed storage and processing system. Junie uses it to store evaluation artifacts and perform large-scale analysis.
With the solution’s support for SQL-like querying and scalable data processing, the team can efficiently aggregate insights across hundreds of tasks and track agent performance over time.
Developers rely on this data to:
Track the percentage of solved tasks (their “North Star” metric).
Analyze the average cost per task for LLM API usage.
Break down agent behavior ( like the most frequent commands or typical failure points).
Compare performance between agent versions.
Scalability through automation
By using Kotlin DSL and TeamCity’s composable build model, Junie scales evaluations to hundreds of tasks per session – far beyond what could be managed manually. For larger datasets (typically 300-2000 tasks), each execution is spun up in parallel, minimizing runtime and allowing the team to test changes frequently.
“We use Kotlin DSL to configure everything. When you have 13 builds, you can still manage them manually, but when it’s 399, or 500, or 280, it starts getting tricky.”
Danila Savenkov, Team Lead, JetBrains Junie
Results: reproducible, scalable, insight-driven agent development
TeamCity has enabled Junie to measure agent performance efficiently and at scale, making their development process faster, more reliable, and data-driven.
Key outcomes
Challenge
Result with TeamCity
Validate agent changes at scale
100+ tasks per run, reducing statistical noise
Long evaluation cycles (24+ hrs)
Tasks run in parallel – now completed in a manageable window
Inconsistent local testing
Every run is reproducible and traceable to the exact agent and dataset
Expensive LLM usage
Per-task usage is tracked, helping optimize development and costs
Fragile logging and data loss
Logs and outcomes are automatically stored for later debugging and review
There are many compelling reasons to use TeamCity as your CI server. Thanks to its out-of-the-box features, smart test management capabilities, and great scalability for enterprises, TeamCity offers a robust and reliable CI solution. But if you’re really looking to increase compliance and improve code quality and security, you can couple it with Qodana.
Integrating Qodana’s static code analysis can significantly improve the quality of your codebase and help you enforce better standards in your CI/CD pipeline. With built-in support through a dedicated Qodana build runner, it’s becoming increasingly easy to embed code quality checks directly into your development workflow.
In this post, we’ll explore how Qodana and TeamCity complement each other and how to get started with your integration process.
Table of Contents
Bringing Qodana into TeamCity
Qodana is available as a build runner within TeamCity, making it simple to incorporate static analysis into your existing builds. To get started, make sure that your project is built using a language supported by Qodana, such as Java, Kotlin, PHP, Python, JavaScript, TypeScript, Go, or C#.
Qodana is compatible with various IDEs and any CI pipeline, including all JetBrains IDEs (like IntelliJ IDEA and Rider), VS Code, and Visual Studio, as well as platforms like Jenkins and .NET. You can find a list of Qodana linters here.
If you’re running your own TeamCity agents, ensure that Docker is installed and accessible. For users of TeamCity Cloud with JetBrains-hosted agents, this is already set up for you.
It’s worth noting that Qodana doesn’t currently support Windows-based build agents in TeamCity.
Configuring Qodana in your build pipeline
Setting up Qodana in TeamCity is easy.
While the recommended and most straightforward approach is to place your `qodana.yaml` configuration file directly in the repository, Qodana also supports dynamic configuration through TeamCity’s command-line runner. This can be helpful in edge cases, for example, if your team needs to tailor inspections dynamically based on project type, team preferences, or environment.
That said, for most teams, using a versioned `qodana.yaml` file ensures consistency, clarity, and traceability across builds.
Prefer something more visual? Explore Qodana’s code coverage reports in the TeamCity UI – no scripting required.
Step 1: In TeamCity, go to the configuration page of your build and add a new build step.
Step 2: Select the Qodana build runner, and then expand the advanced options to customize its behavior.
Step 3: Define the linter you’d like to use, specify a version, and point to either a default or custom inspection profile. If you’re using Qodana Cloud, you can also add a project token at this stage. This is required for commercial linters, but optional for community ones.
Optional step: For more granular control, you can configure things like a unique report ID, working directory, or whether Qodana reports should be visible under the Tests tab in TeamCity. There’s also support for advanced parameters, such as Docker arguments or additional Qodana CLI options.
For more detailed instructions and more on the function of each step, view the docs.
Quality gates are tools that let you stop code from being merged to the main branch if it doesn’t meet specific requirements, or if too severe or too many issues are flagged. If a quality gate condition fails, Qodana terminates using exit code 255, which makes a CI/CD workflow or pipeline fail.
Qodana makes it easy to set up quality gates that fail a build when the number of issues exceeds a set threshold. It also supports baseline functionality, which allows you to compare the current analysis results with a previous state. This helps identify new problems instead of flagging the same issues with every analysis.
Both of these features are configured using simple command-line arguments in the Qodana runner. There are various ways you can set this up. For example, you can create a quality gate that considers the number of problems before allowing code to be merged (more flexible settings are available in `qodana.yaml`):
failureConditions:
  severityThresholds:
    any: 10 # Total problems
    critical: 5 # Critical and other severities
    high: 5
    moderate: 10
    low: 20
    info: 20
This combination of quality gates and baseline functionality can help your team avoid a crisis as well as unnecessary noise from legacy issues.
If your project requires a custom inspection profile or specific exclusions, you can use a `qodana.yaml` file. You can either include this file in your repository or use a script in TeamCity to generate it on the fly.
Once your build runs, Qodana offers flexible options for reviewing results. You can access detailed analysis directly in the Qodana tab within TeamCity, making it easy to spot issues alongside your other build diagnostics.
Alternatively, you can explore the results in Qodana Cloud, which provides a web-based dashboard with collaboration tools, history tracking, and integration with issue trackers.
Supporting pull requests and branch analysis
Qodana also works well in pull request workflows. The purpose of pull request analysis is to examine code changes in a pull request or merge request, detecting issues introduced or fixed by that specific change.
Qodana compares the current branch against the target branch (e.g. `main` or `develop`), and then it highlights issues only in the changed files or lines.
By configuring VCS triggers in TeamCity, you can analyze merge requests or specific branches before they’re integrated into your main codebase. This adds an essential layer of quality assurance to every code review.
Then baseline track new problems introduced over time by comparing the current analysis results with a previous “clean” state.
You can generate a baseline file, and in future runs, Qodana compares the current issues against this baseline. Only new issues (not present in the baseline) are reported as problems.
These approaches can be combined for better quality gates and enforcement.
TeamCity Cloud and Qodana Cloud for better quality software products
Integrating Qodana into your TeamCity pipeline gives you a solid foundation for a healthier codebase. With static analysis running automatically as part of your build process, you reduce the chance of bugs slipping through and can use Qodana to enforce quality as a team.
TeamCity and Qodana compliment each other, with TeamCity managing your builds with Qodana ensuring that your code is clean and something you can be proud of. Both help prevent future issues, and together, they offer an automated, and scalable approach to CI/CD – with built-in code quality from day one.
Frequently Asked Questions
How do I use Qodana to analyze .NET projects?
To analyze .NET projects, you can use the `qodana-dotnet` Docker image or the native solution based on Rider. There’s also a Community Edition available via the `qodana-cdnet` Docker image, but it’s better to use the trial version of a paid license for greater functionality.
Why is TeamCity often used with Qodana instead of other analyzers?
TeamCity and Qodana are both created by JetBrains, which means deep integration that’s not easily reproduced by competitors.
This article was brought to you by Rajkumar Venkatasamy, draft.dev.
Migrating from Jenkins can feel risky. Your pipelines work, your jobs run, and your scripts hold everything together. Jenkins isn’t broken, but over time, plugin sprawl, configuration drift, and upgrade headaches can quietly drain engineering time.
But what if there’s another option?
TeamCity’s user-friendly interface, built-in features, and seamless integrations can streamline your DevOps while reducing your reliance on plugins.
You don’t need to migrate everything at once. Start small. Move a single standalone project (a basic build or unit test job) and run it in parallel with Jenkins. This lets you evaluate TeamCity’s built-in features, cleaner configuration, and reduced maintenance overhead without disrupting your existing workflows.
In this guide, we’ll walk you through how to migrate one project step by step, so you can test TeamCity before committing to a full transition.
How to move a single Jenkins project to TeamCity without breaking things
In this article, we’ll walk you through the migration process step by step so you can replicate it confidently. The key is methodical preparation, careful implementation, and thorough validation.
To really benefit from this guide, it’s best if you understand basic DevOps concepts and have hands-on experience with DevOps tools like Jenkins/TeamCity.
Preparation
Before touching TeamCity, take stock of your Jenkins job. This inventory phase is important because it uncovers dependencies that could trip you up later.
Start by selecting a simple, standalone job. An ideal candidate is a basic build-only task or a set of unit tests that aren’t constrained by complex pipelines or shared resources.
For example, log in to your Jenkins instance and navigate to the job’s Configuration page. Document everything: The source code repository (e.g. Git URL and branch), triggers (like on-commit webhooks or schedules), environment variables, and any build steps (such as shell commands or Maven/Gradle goals for a Java project):
Note the plugins in use. Jenkins often relies on plugins for basic integrations (like the Git plugin), whereas TeamCity handles much of this functionality natively:
It’s also helpful to note performance baselines, like the build-run wait times and duration. This gives you metrics to compare post-migration:
If your Jenkins job uses credentials, list them securely:
Spending 30 to 60 minutes tracking down all this info can save hours of debugging.
Implementation
When you’ve completed your preparation phase, it’s time to bring TeamCity online.
Start by setting up your TeamCity server by choosing one of the following options: TeamCity Cloud or on-prem. TeamCity Cloud is great for quick, managed hosting. It’s also ideal for testing, as it’s hassle-free and requires no provisioning.
However, the trial is only fourteen days, so make sure that you’ve set aside time for testing. You can also choose to install our on-premises version for full control.
Creating a new project and connecting your repository
Once the TeamCity setup is complete, log in to the UI and create a new project. Enter your GitHub repo URL (e.g. https://github.com/yourorg/yourrepo.git) and configure authentication. Use an access token or SSH key for security, depending on your repo setup. TeamCity supports major providers out of the box. This ensures that builds automatically pull the latest code.
TeamCity handles branching and change detection natively using webhooks and path filters, so you get faster, more reliable triggers without having to install or maintain any plugins.
Adding and customizing build steps
Once your project is created, TeamCity looks at your pom.xml or build.gradle and suggests the next Maven or Gradle build steps, which you can customize as needed.
You can then replicate the required build steps from your Jenkins job in the TeamCity project’s build configuration.
TeamCity provides numerous built-in runners with no plugins required. For a Maven build, select the Maven runner and input goals like “clean package”; for Gradle, choose the Gradle runner and enter your tasks the same way. You can find detailed instructions for tweaking runners and adding extra options in this guide.
If your Jenkins step was a generic shell command, opt for TeamCity’s Command Line runner. Unlike in Jenkins, where you might default to “Execute shell” for everything, which often results in less-structured, harder-to-maintain jobs, TeamCity encourages more organized, maintainable build steps.
If you’re more code-oriented and prefer scripting over UI clicks, TeamCity offers configuration as code via the Kotlin DSL. This is helpful for version-controlled setups, similar to Jenkins’s Groovy pipelines, but with type safety and IDE support. It lets you commit your configs to Git, enabling reviews and rollbacks, which is perfect for teams who treat infrastructure as code.
And here’s the best part: You don’t have to choose between UI and code! You can start in the UI, play around with your build configuration, get everything working, and when you’re ready, click View as code. TeamCity autogenerates clean, ready-to-commit Kotlin code based on your UI setup.
This means you can learn visually, validate that everything works, then export to code with zero friction and no retyping.
Once you’ve customized build steps, configure build triggers to automate runs. In the triggers section of TeamCity’s Build configuration, add a VCS trigger for on-commit builds. This enables the tool to watch your repo for changes and kick off builds. For scheduled jobs, use Schedule trigger to specify cron-like expressions.
TeamCity’s build triggers go far beyond “run on commit” or “run on a schedule”. They include Finish Build Trigger, VCS Trigger, and Retry Build Trigger:
Advanced triggering: Chaining builds without plugins
TeamCity only lets one build configuration automatically start another when a specific condition is met.
In Jenkins, achieving the same level of orchestration often means installing and configuring extra plugins (like the Parameterized Trigger plugin or Pipeline: Multibranch), each of which adds maintenance overhead and potential version-compatibility headaches.
With TeamCity, these capabilities are available out of the box, so you can chain builds, promote artifacts, or gate deployments without leaving the core product.
Real-time GitHub status updates
TeamCity also instantly posts detailed commit statuses back to GitHub as Passed, Failed, or In Progress, with direct links to the exact build log.
This real-time feedback loop, powered by TeamCity’s native GitHub integration, doesn’t require additional plugins or webhooks. Developers see the outcome seconds after pushing, not minutes later after a polling interval or a misconfigured webhook or plugin.
Managing parameters and environment variables
Add build parameters and environment variables. TeamCity’s model backing the parameters and environment variables configuration is flexible and secure. You can define both parameters and environment variables (be it sensitive or nonsensitive variables) in the Parameters section by choosing text for simple strings, password for secrets (stored encrypted on the server, never exposed in logs), or select for dropdown options.
For instance, if your Jenkins job uses a nonsensitive env var like APP_NAME, create a new environment-variable input parameter with the value type set as text, and key in the value as Your_APP_NAME.
If your Jenkins job uses a sensitive env variable like DB_PASSWORD, create a password parameter in TeamCity. You can refer to these env variables as %DB_PASSWORD% in steps or as ${DB_PASSWORD} in custom scripts within TeamCity.
Secure secrets handling
Unlike Jenkins, which requires separate plugins for secrets management and vault integration, TeamCity has native support for external vaults, like HashiCorp Vault, keeping sensitive data centralized and audit-friendly.
This step builds resilience as parameters allow easy overrides for different environments without rewriting or setting up the build configuration for each environment.
Validation and cutover
Once you’ve built the project in TeamCity, you need to verify that it works. Start by manually triggering a build in TeamCity. Watch the logs in real time; TeamCity’s interface highlights errors and provides timestamps for you to easily observe and troubleshoot when needed. Compare the artifacts and results against your Jenkins baseline.
If issues occur during the build process execution, common causes could be path mismatches (TeamCity’s checkout directory might differ, and in such a case, make adjustments in the VCS settings) or permissions (ensure agents have access to the build tools, like Gradle or Maven, used by your project).
In general, while troubleshooting, do it systematically. For instance, you have to check environment vars if builds fail on missing dependency variables or verify credentials for auth errors.
Additionally, during your first migration phase, run jobs in parallel (i.e. keep Jenkins active while testing TeamCity). Trigger the build for the same commit in both tools and compare the outputs. This parallel run builds trust and helps you see which tools actually perform better.
Once it’s validated (e.g., after a few successful autotriggered builds) retire the Jenkins job. Disable it first, monitor for a day, then delete. This gradual cutover minimizes risk, letting you roll back if needed.
Conclusion
If you followed along, you just finished migrating a single Jenkins project to TeamCity. You’ve demystified the process, learned more about TeamCity’s intuitive tools, and likely spotted efficiencies like reduced plugin bloat or superior secrets management. This isn’t just a tech swap; it’s a step toward a more reliable, developer-friendly CI/CD.
Now that you’re comfortable, imagine scaling this across your portfolio. TeamCity’s project hierarchies and templates make it easy, but planning is key for larger migrations.
Whether you’re a developer tweaking builds or a DevOps engineer orchestrating workflows, this first win should inspire confidence.
This blog post was brought to you by Aykut Bulgu, draft.dev.
When a Jenkins installation starts to feel slow, the first symptom is usually the queue. Builds sit longer than they should, feedback takes too long to reach developers, and the CI system starts demanding more attention from the platform team than anyone wants to give it.
That pattern is familiar to teams that adopted Jenkins early and then kept expanding it. Jenkins can scale, but at larger sizes it often requires careful controller sizing, plugin management, and, in many organizations, multiple controllers to spread the load. That works, but it also adds operational overhead.
For DevOps engineers and architects, that overhead matters. CI/CD is part of the delivery path, and when the platform becomes harder to maintain, engineering teams feel it quickly.
In this article, we’ll look at the scaling challenges teams commonly run into with Jenkins and how TeamCity’s server–agent architecture helps reduce that operational burden while supporting growth from a few pipelines to hundreds.
The scaling challenges of Jenkins
At a high level, Jenkins uses a controller–agent model. A central controller manages configuration, scheduling, and coordination, while agents run the actual builds. TeamCity also uses a central server with build agents, so the high-level pattern is similar. The difference shows up in how the two systems are typically operated and extended at scale.
Running Jenkins on Kubernetes can improve agent provisioning and make burst capacity easier to manage, but it does not remove the need to manage controller load, plugin compatibility, and governance across the system.
Controllers can become bottlenecks
As more teams, repositories, and pipelines are added, the Jenkins controller takes on more work:
Managing job and pipeline configuration
Scheduling builds and coordinating agents
Serving the UI and handling API requests
Maintaining plugin state and runtime behavior
Under heavier load, the controller can become a bottleneck. Jenkins documentation and ecosystem guidance often point larger organizations toward multi-controller strategies to distribute load. That can be effective, but it introduces additional work around governance, version alignment, and visibility across teams.
Horizontal scaling is not just a matter of adding agents
Adding more Jenkins agents improves execution capacity, but it does not solve controller-side coordination and configuration challenges. As teams grow, they often end up dealing with:
Different plugin versions across controllers
Inconsistent job definitions and conventions
Repeated work to manage credentials, shared libraries, and policy enforcement
At that point, scaling Jenkins often means operating a group of controllers, maintaining shared libraries, and building internal processes to keep everything consistent.
Plugin dependency adds operational risk
A large part of Jenkins’s flexibility comes from its plugin ecosystem. That is one of its strengths, but it also creates operational tradeoffs at scale. Plugin-heavy environments can:
Create upgrade chains where one plugin update affects others
Add performance or memory overhead on the controller
Make troubleshooting harder because behavior is distributed across plugin-specific logs and extension points
In many Jenkins environments, the platform team ends up spending significant time validating plugin updates, checking compatibility, and troubleshooting interactions between components.
TeamCity’s server–agent architecture
TeamCity also uses a central server with build agents, but the platform is designed to keep configuration centralized while letting execution scale outward.
The TeamCity server handles orchestration. It stores configuration, build history, and artifact metadata, manages queues and dependencies, and provides the UI and REST API. For production use, TeamCity supports external databases, which is an important part of scaling larger installations.
Image courtesy of Aykut Bulgu
Build agents handle execution. They check out source code, run build steps and tests, publish artifacts and reports, and send results back to the server.
Agents are separate pieces of software installed on physical or virtual machines. They maintain a connection to the server and receive work assignments there, which simplifies deployment in environments where inbound networking is restricted.
That separation matters in practice. Agents can be added horizontally, including in cloud environments, while the platform retains centralized configuration and visibility.
Built-in scalability features in TeamCity
Beyond the core server–agent model, TeamCity includes features that help teams scale without continually redesigning the CI system.
Elastic agents and cloud integrations
TeamCity supports agents on both physical and cloud-hosted machines and can start cloud agents on demand through built-in cloud integrations and officially supported plugins. That makes it easier to handle temporary spikes in demand without permanently increasing capacity.
Consider a team that usually runs on ten on-premises agents and keeps build times predictable during a normal week. After a large batch of pull requests is merged, the queue grows sharply. With cloud profiles configured, TeamCity can start temporary cloud agents, reduce the queue during the spike, and then remove that temporary capacity when demand drops.
From the developer’s perspective, the important result is consistency: feedback remains reasonably fast even when build volume changes.
Visual build chains instead of heavily assembled pipeline logic
TeamCity’s build chains let you define sequences and graphs of builds connected through snapshot and artifact dependencies. This makes it easier to model pipelines where related parts of the workflow share a consistent VCS snapshot.
Build chains can model workflows such as build → test → package → deploy, run dependent builds in parallel when possible, and reuse artifacts to avoid redundant work. Because build chains are a core concept in TeamCity, teams can model complex flows without stitching together multiple extensions to get dependency visibility.
Jenkins pipelines do support multi-stage workflows natively through Jenkinsfile, but in larger installations teams often combine pipelines with shared libraries, controller-specific conventions, and additional plugins for orchestration, visibility, or environment handling. TeamCity’s approach is more opinionated and more centralized.
Take a product made up of a shared library, a backend API, and a frontend SPA. In TeamCity, you can define a build chain where the shared library build runs first, then fans out into backend and frontend builds, and finally feeds a packaging or deployment build that depends on both.
That dependency graph is visible in the UI and managed as part of the platform rather than assembled from several separate pieces.
Intelligent agent selection
TeamCity matches builds to agents based on requirements and capabilities. That helps with resource use and reduces manual scheduling overhead as environments become more specialized.
For example, an organization might have:
Linux agents with Docker and Java 21 for backend services
Windows agents with .NET SDKs for legacy applications
macOS agents with Xcode for mobile builds
Each build configuration can declare what it needs: operating system, installed toolchains, or custom parameters such as docker.server.osType = linux or specific version requirements.
When a build is queued, TeamCity routes it to an agent that satisfies those requirements. That keeps scheduling rules in configuration instead of leaving them in tribal knowledge or local conventions.
Reliability and maintainability advantages
Scaling is not only about throughput. It is also about how much effort it takes to keep the platform stable as the number of projects grows.
Fewer moving parts
TeamCity includes first-class support for many common workflows, so teams often rely less on third-party extensions for core CI/CD behavior. Features such as test reporting, parallel test execution support, flaky test detection, and visual dependency management are part of the product. That generally leads to more predictable upgrades and fewer surprises caused by extension interactions.
Centralized configuration
In Jenkins environments with multiple controllers, teams often duplicate configuration patterns, credentials management, and job conventions across instances. In TeamCity, projects, templates, and build configurations live under a single server or a smaller number of servers, which makes it easier to standardize quality gates, permissions, and reusable settings across teams.
That centralization makes governance easier to implement consistently.
Simplified upgrades and lower downtime risk
A plugin-heavy Jenkins environment can turn upgrades into a lengthy validation exercise. With TeamCity, teams are usually dealing with fewer critical third-party dependencies, a clearer upgrade path for the server and agents, and centralized control over versioning. Upgrades still require planning, but the operational surface area is typically smaller.
Real-world benefits for DevOps engineers and architects
In practice, this leads to several benefits:
Lower operational overhead: Scaling is more often about adding or tuning agents, reviewing queue behavior, and standardizing configuration rather than adding more controllers and validating large plugin combinations.
Better developer feedback loops: Visual build chains, parallel execution, and detailed reporting help teams understand failures faster and keep queue times more predictable.
More manageable growth: As organizations add services, languages, and delivery targets, TeamCity gives platform teams a centralized way to grow CI/CD capacity without rebuilding governance from scratch.
Jenkins vs. TeamCity
The following diagram provides a high-level comparison of how Jenkins and TeamCity are commonly operated at scale.
Image courtesy of Aykut Bulgu
Here’s a summary of how the two architectures compare on the dimensions discussed in the article:
Aspect
Jenkins
TeamCity
Why it matters
Core architecture
Controller–agent model; controller handles UI, scheduling, and extensions
Server–agent model; server handles orchestration and state while agents execute builds
Both use a central coordinator, but operational complexity differs at scale
Scaling strategy
Can scale, but larger installations often use multiple controllers and careful governance
Typically scales by adding agents and organizing projects centrally
Lower operational overhead makes growth easier to manage
Plugin dependence
Strong ecosystem; many installations rely on plugins and shared libraries for integrations and platform behavior
Many core capabilities are built in, reducing dependence on third-party extensions for central workflows
Fewer critical dependencies generally reduce upgrade and troubleshooting risk
Pipelines / orchestration
Jenkinsfile-based pipelines are native; larger setups often add shared libraries and plugins around them
Build chains, snapshot dependencies, and artifact dependencies are first-class concepts with visual support
Easier dependency visibility can simplify large delivery flows
Agent management
Dynamic agents are often implemented through plugins or external platform work
Supports physical and cloud agents, with built-in cloud integrations and supported plugins
Both can scale execution, but TeamCity centralizes more of the experience
Workload placement
Labels, node selection, and pipeline logic
Agent requirements and capabilities matched by the server
Multi-controller environments and plugin coordination increase admin effort
Centralized server model and fewer critical external dependencies simplify administration
Lower maintenance burden improves platform stability over time
Note: TeamCity’s on-premises edition is free for up to three build agents; scaling beyond that requires additional agent licenses, as described on the TeamCity on-premises pricing page. TeamCity Cloud uses a different usage-based pricing model and does not have the same “three agent” limit.
Conclusion
Jenkins remains a capable and widely used CI/CD platform, but at enterprise scale it often requires more architectural planning and more day-to-day coordination from the platform team. Controller load, plugin management, and multi-controller governance are all manageable, but they come with real operational cost.
TeamCity approaches the same problem with centralized orchestration, horizontally scalable agents, and more built-in support for dependency modeling, test visibility, and environment management. For teams that want to scale CI/CD without assembling as much of the platform themselves, that can be a meaningful advantage.
If your current Jenkins setup is already demanding controller workarounds, plugin validation cycles, and custom governance processes, it may be worth evaluating whether a more centralized platform would reduce that burden. TeamCity is designed to support that shift while keeping the developer experience consistent as the organization grows.